 3
3peptides
spectra
0.000 | 0.005
0.098 | 0.312
0.000 | 0.159
0.000 | 0.000
0.000 | 0.038
0.244 | 0.395
0.333 | 0.423
0.000 | 0.000
1peptide
spectra
NA | NA
NA | NA
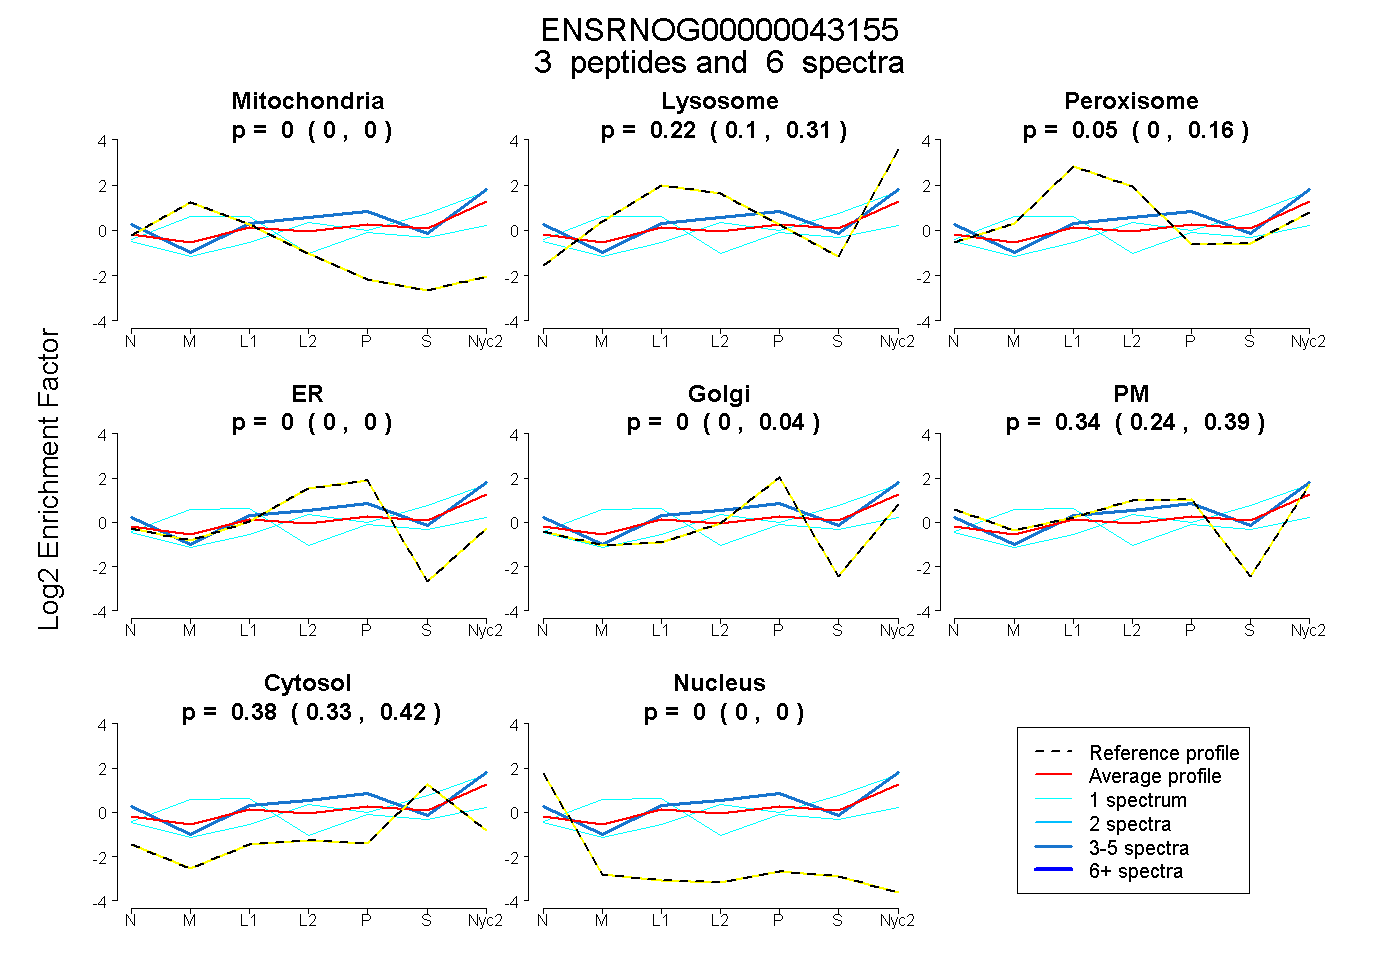
| Plot | Mito | Lyso | Perox | ER | Golgi | PM | Cytosol | Nucleus | |||||
| Expt A |
3 peptides |
6 spectra |
|
0.000 0.000 | 0.005 |
0.224 0.098 | 0.312 |
0.055 0.000 | 0.159 |
0.000 0.000 | 0.000 |
0.000 0.000 | 0.038 |
0.337 0.244 | 0.395 |
0.384 0.333 | 0.423 |
0.000 0.000 | 0.000 |
||
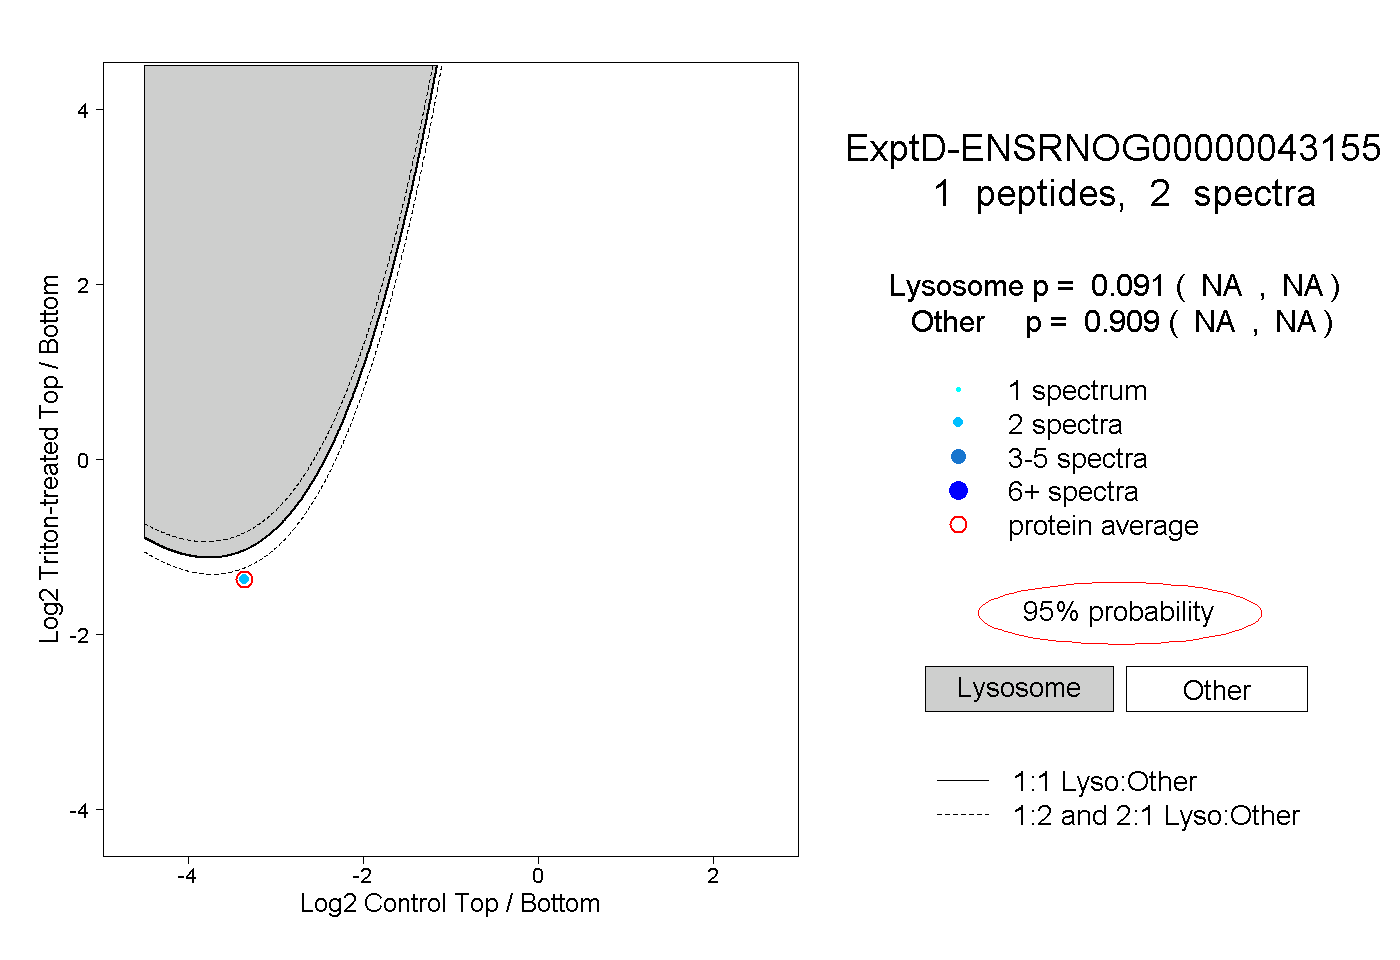
| Plot | Lyso | Other | |||||||||||
| Expt D |
1 peptide |
2 spectra |
|
0.091 NA | NA |
0.909 NA | NA |