 12
12peptides
spectra
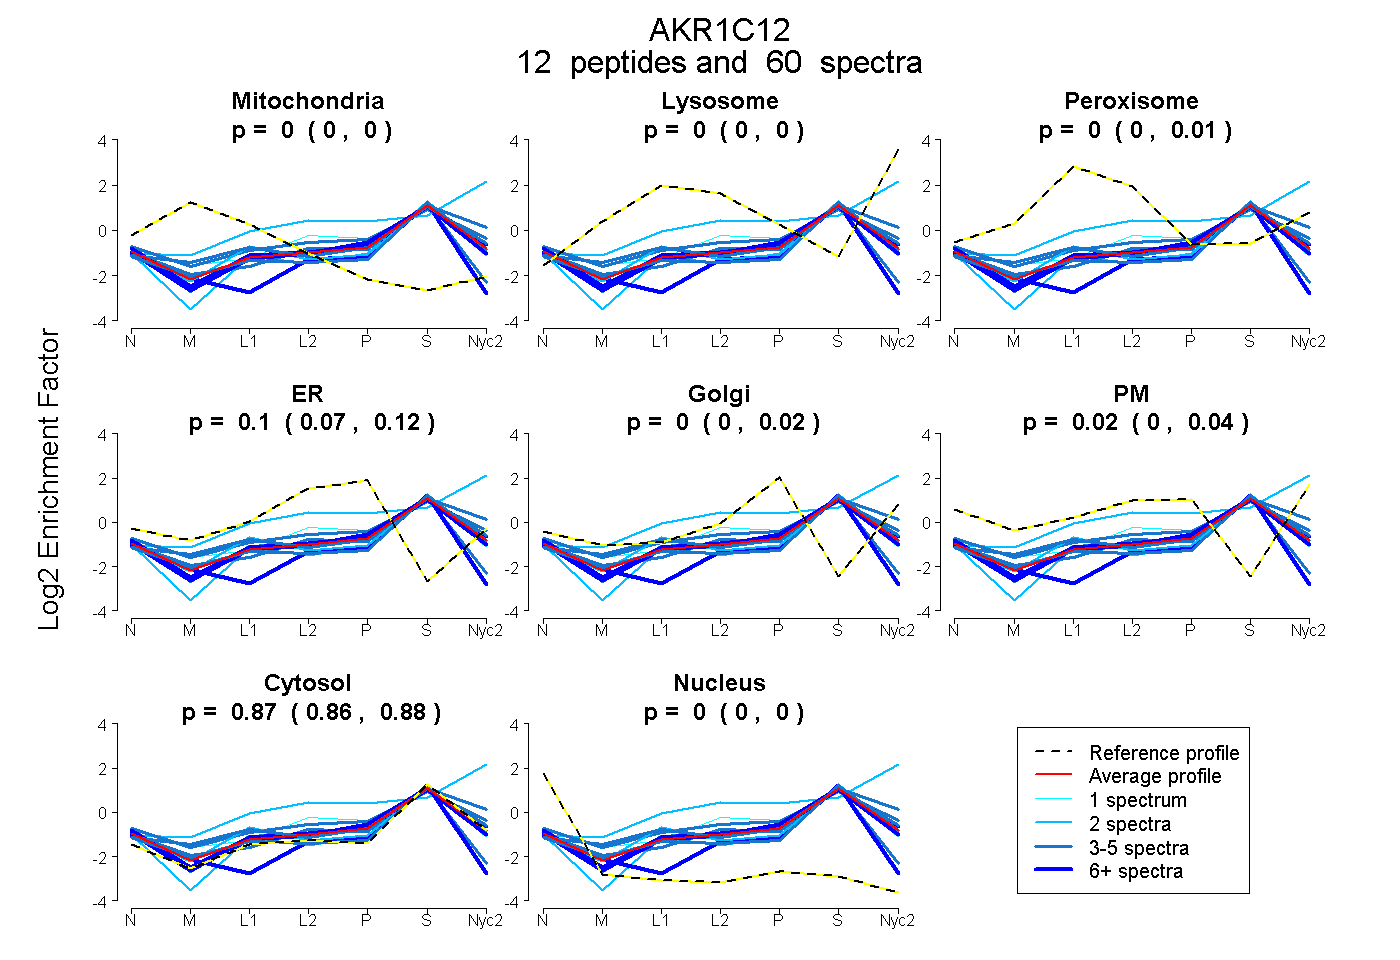
0.000 | 0.000
0.000 | 0.000
0.000 | 0.013
0.067 | 0.121
0.000 | 0.016
0.000 | 0.044
0.865 | 0.877
0.000 | 0.000
6peptides
spectra
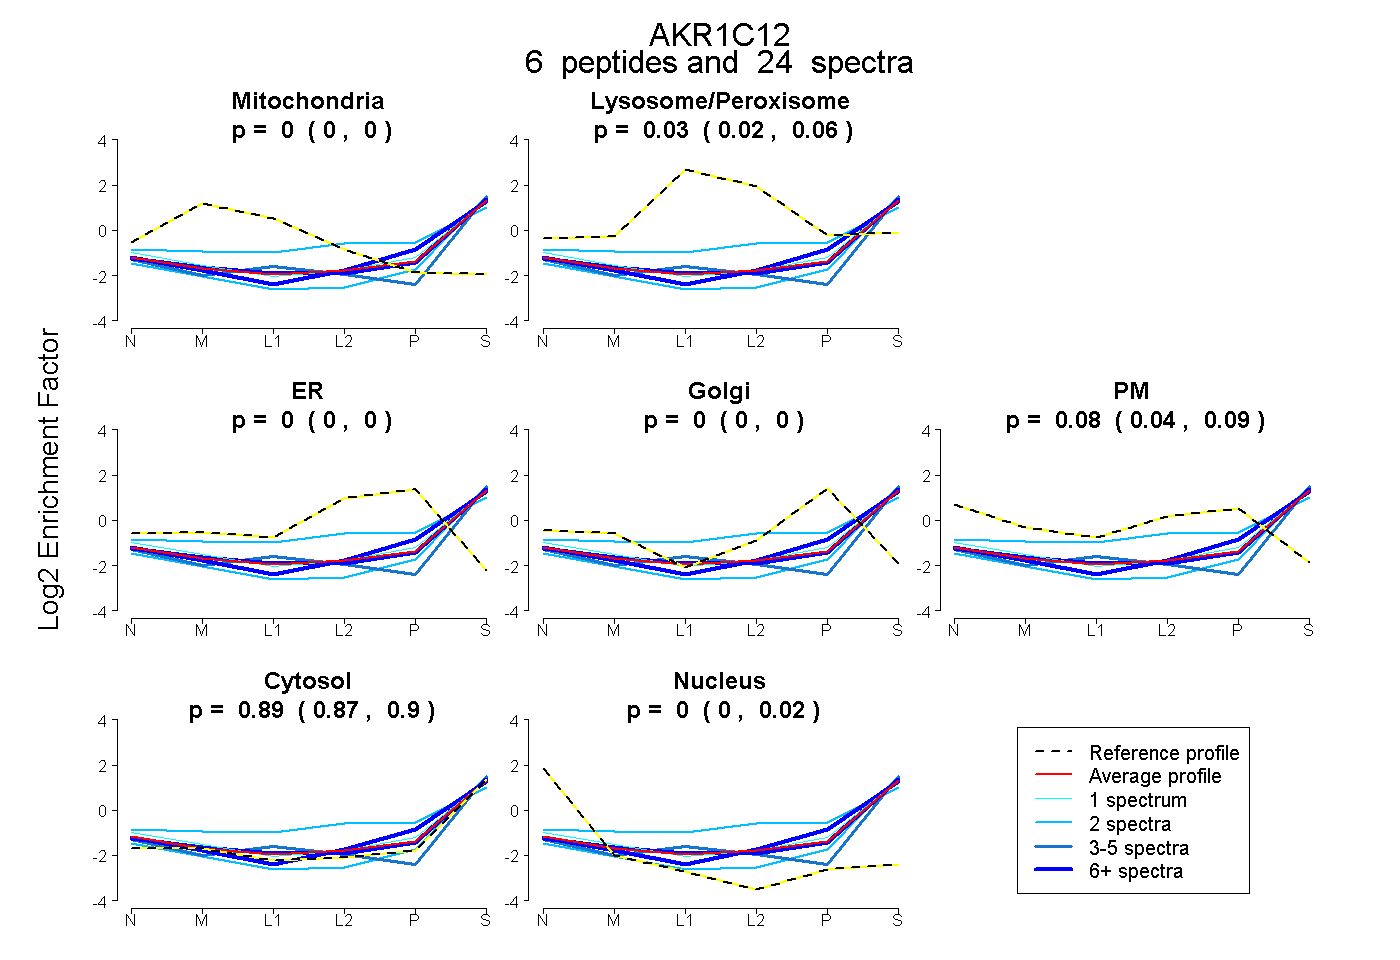
0.000 | 0.000
0.015 | 0.055
0.000 | 0.000
0.000 | 0.000
0.042 | 0.091
0.875 | 0.896
0.000 | 0.016
11peptides
spectra
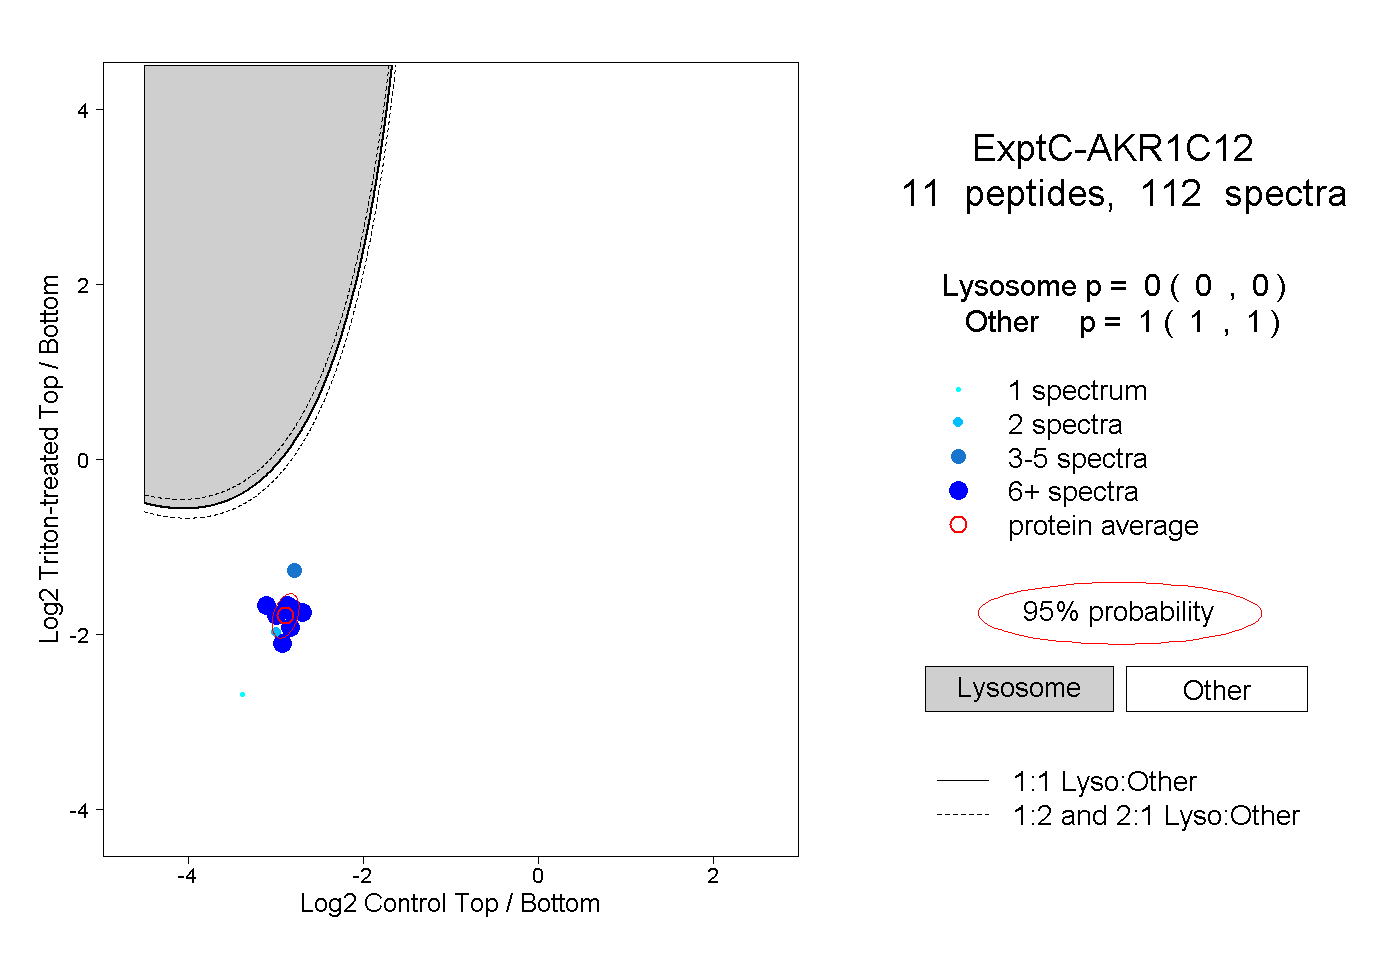
0.000 | 0.000
1.000 | 1.000
2peptides
spectra
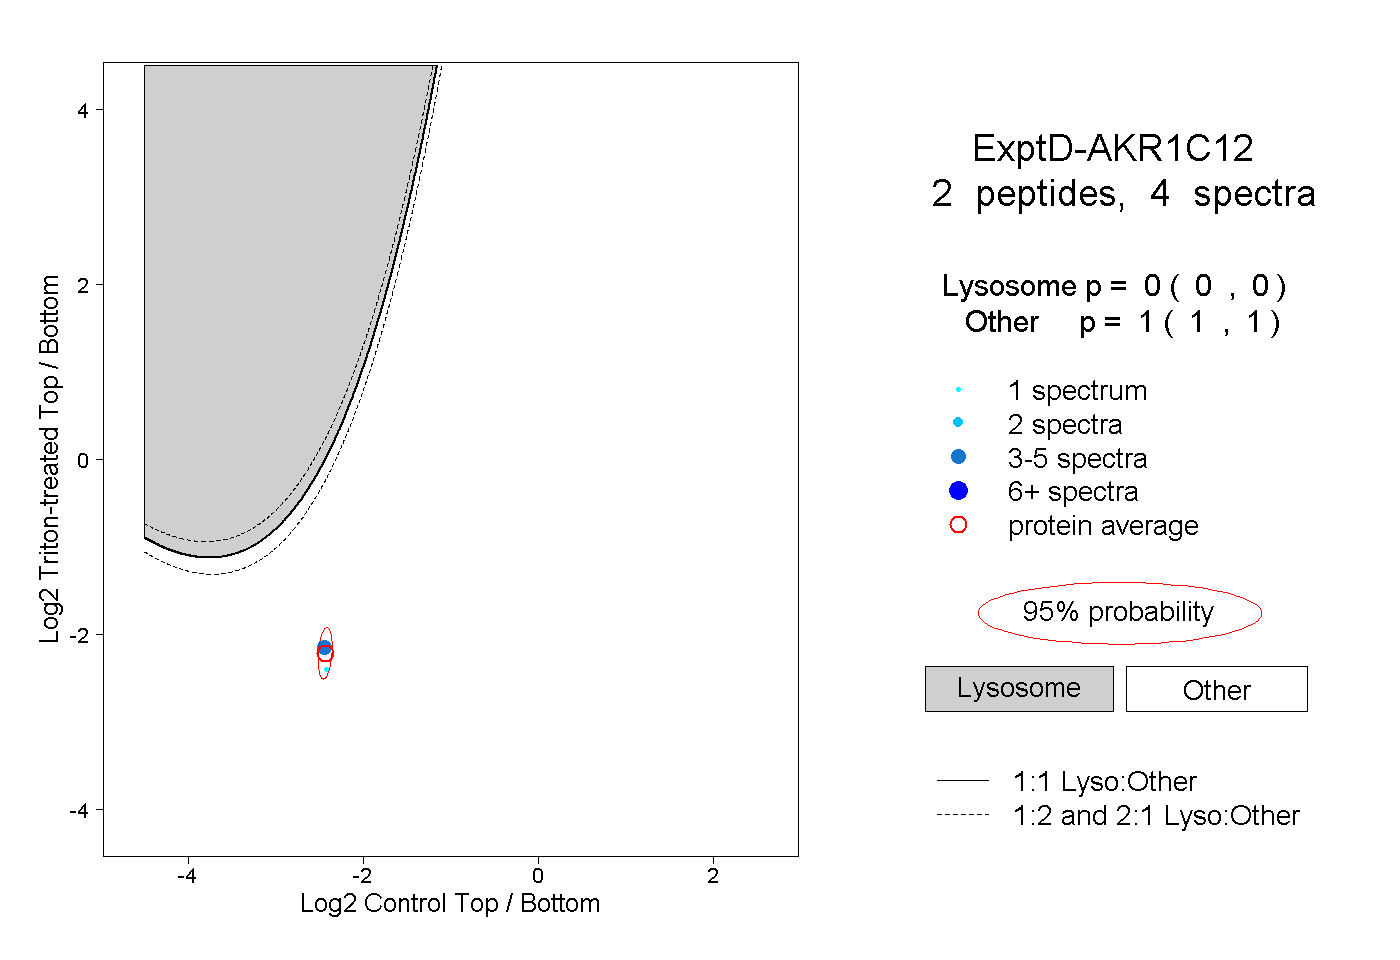
0.000 | 0.000
1.000 | 1.000