 7
7peptides
spectra
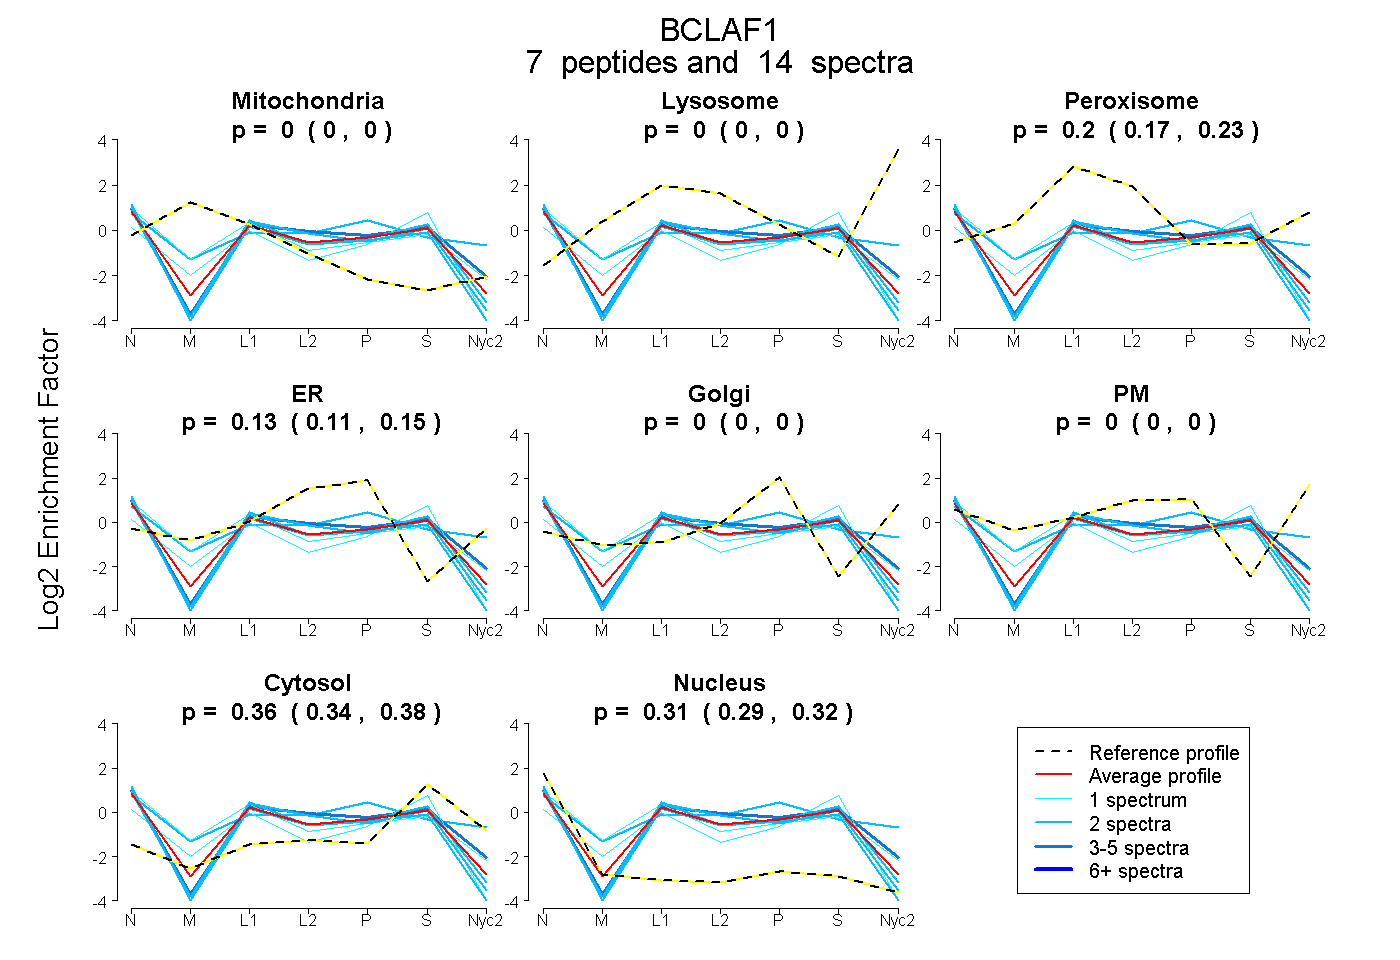
0.000 | 0.000
0.000 | 0.000
0.173 | 0.226
0.109 | 0.147
0.000 | 0.000
0.000 | 0.000
0.336 | 0.384
0.287 | 0.323
3peptides
spectra
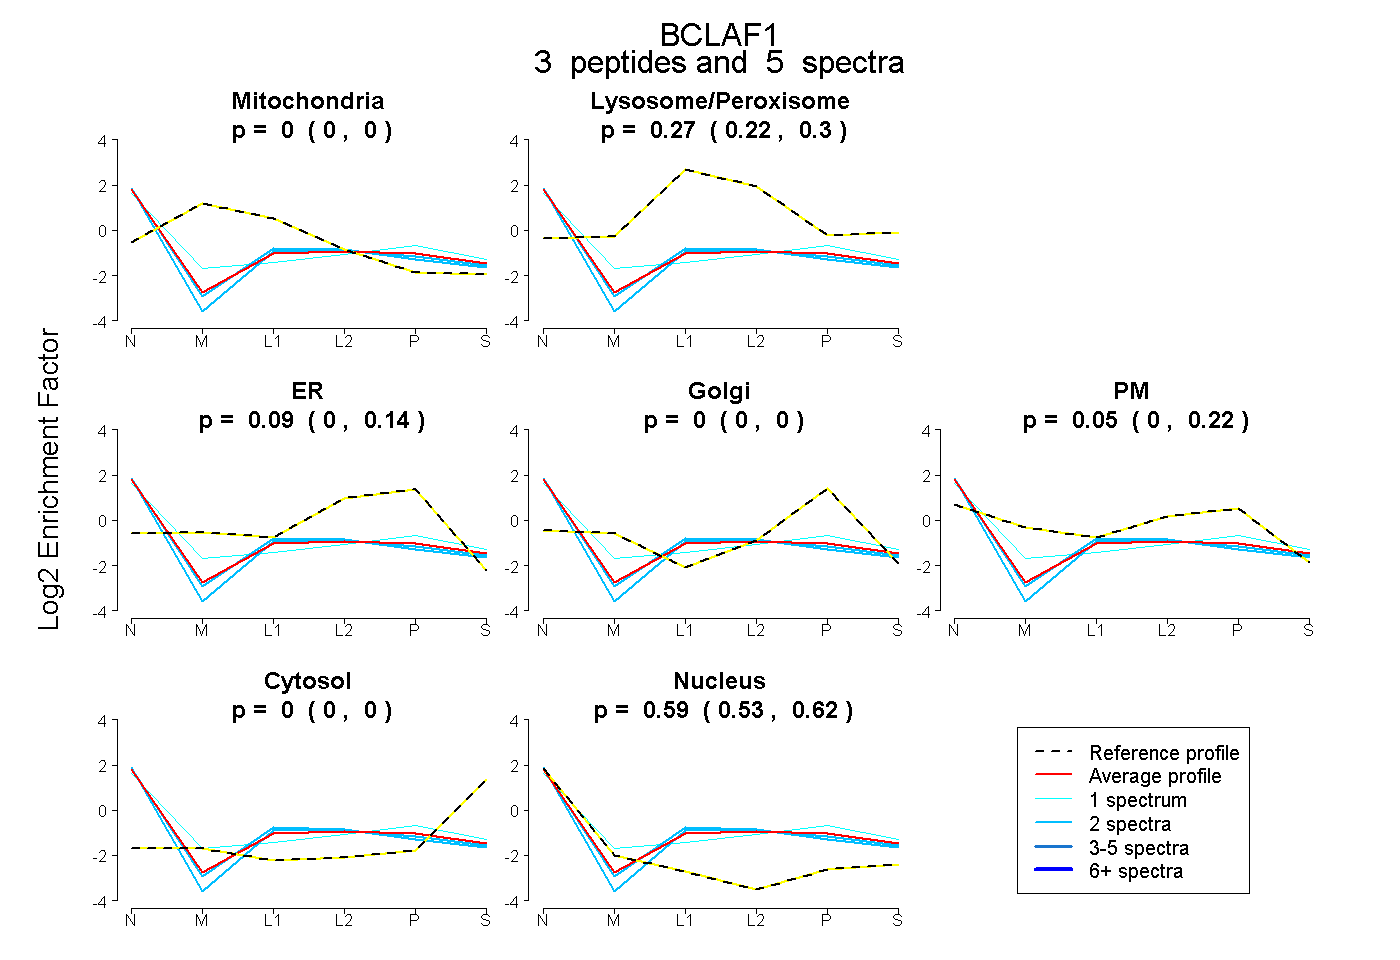
0.000 | 0.000
0.221 | 0.298
0.000 | 0.136
0.000 | 0.000
0.000 | 0.223
0.000 | 0.000
0.531 | 0.624
2peptides
spectra
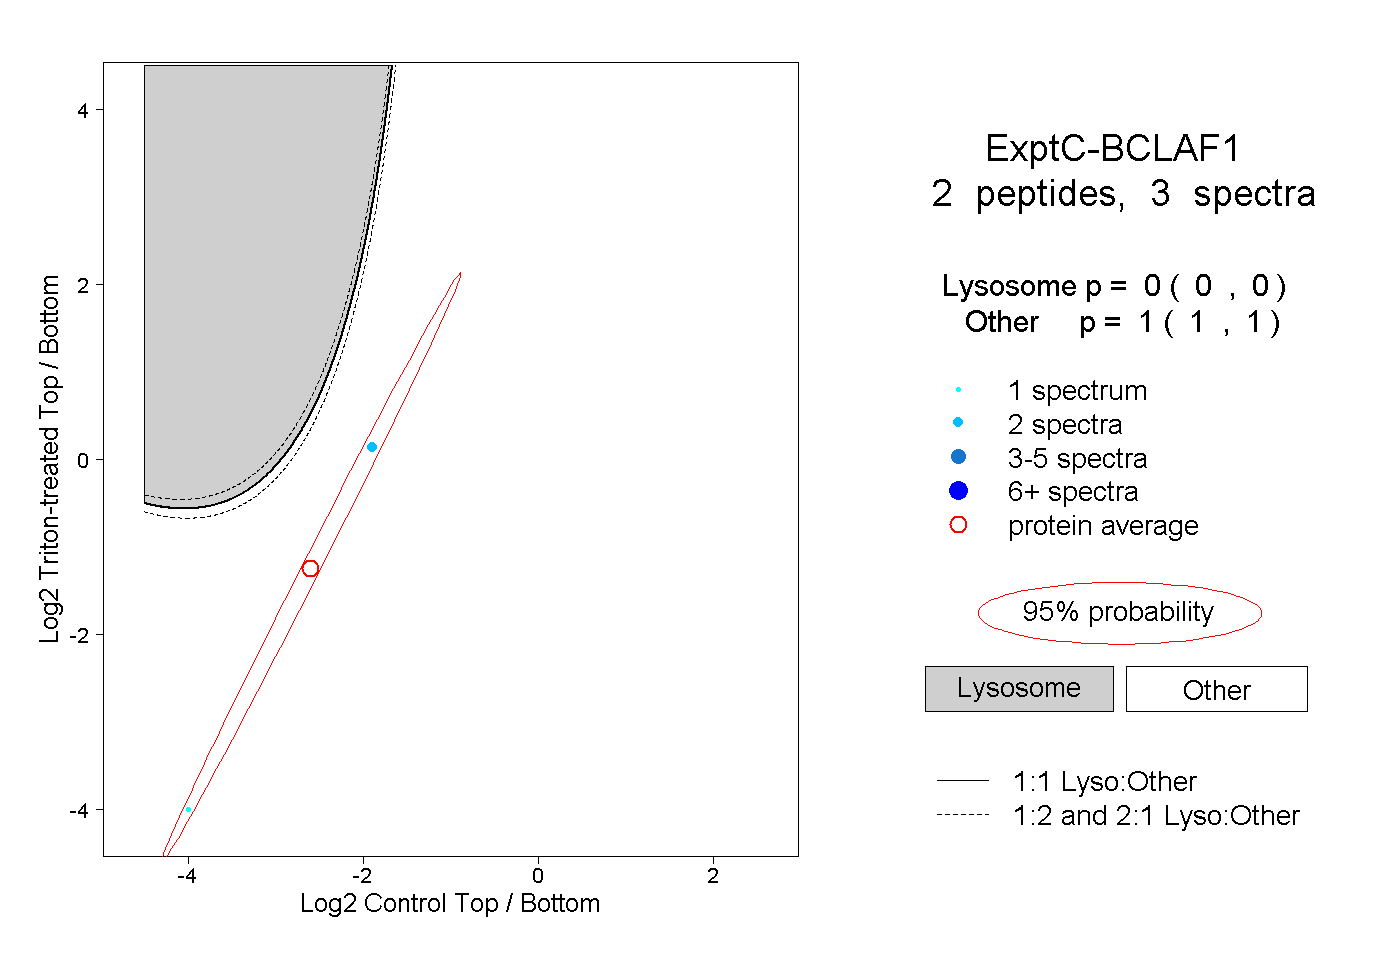
0.000 | 0.000
1.000 | 1.000
1peptide
spectra
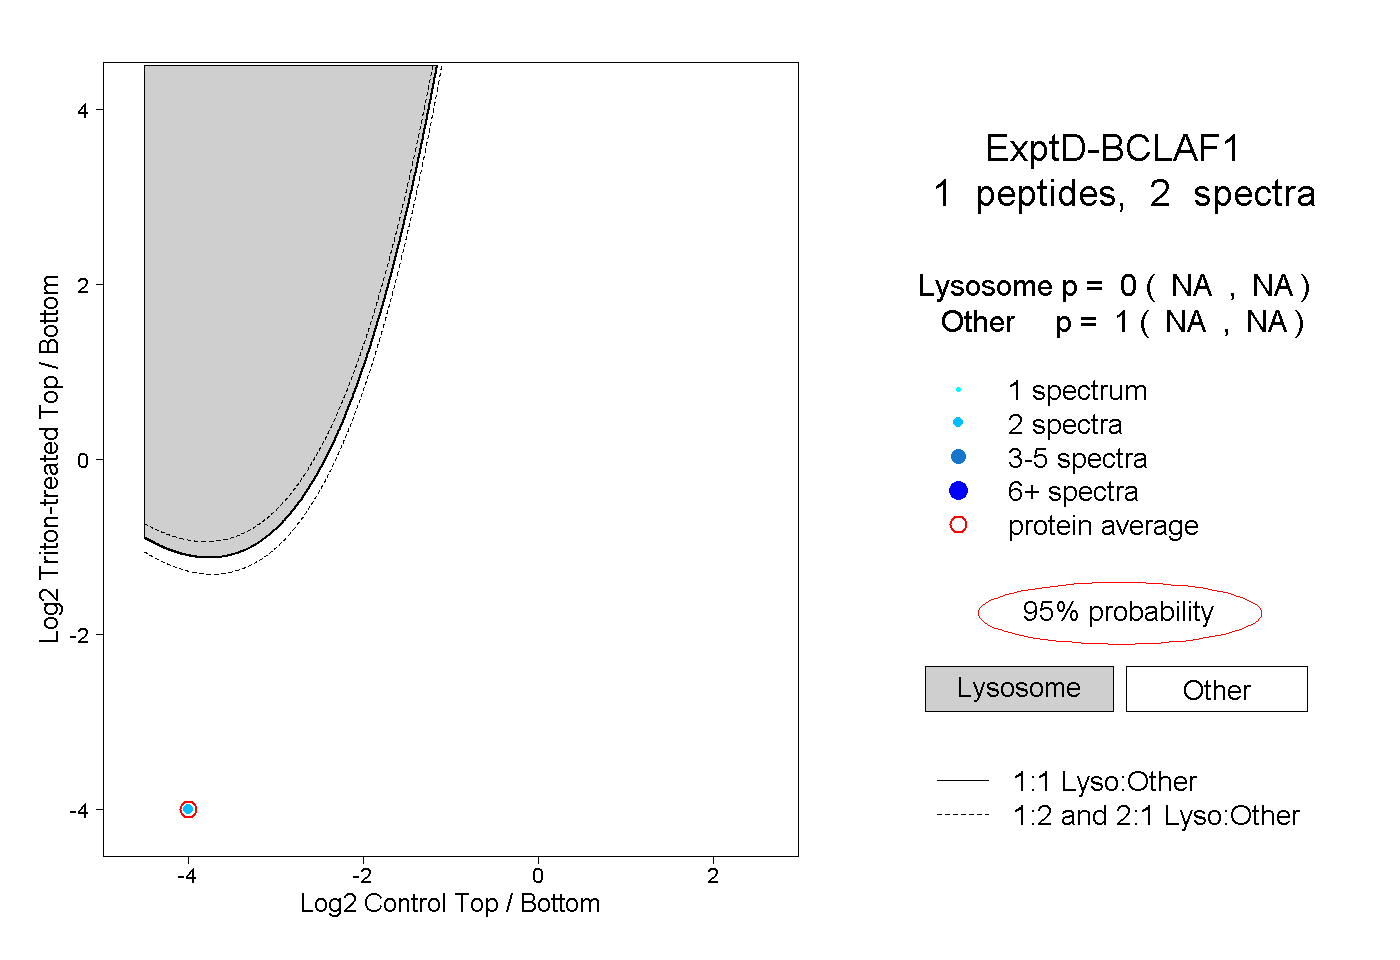
NA | NA
NA | NA