 2
2peptides
spectra
0.000 | 0.013
0.000 | 0.000
0.173 | 0.337
0.363 | 0.673
0.032 | 0.278
0.000 | 0.000
0.000 | 0.089
0.000 | 0.023
| Plot | Mito | Lyso | Perox | ER | Golgi | PM | Cytosol | Nucleus | |||||
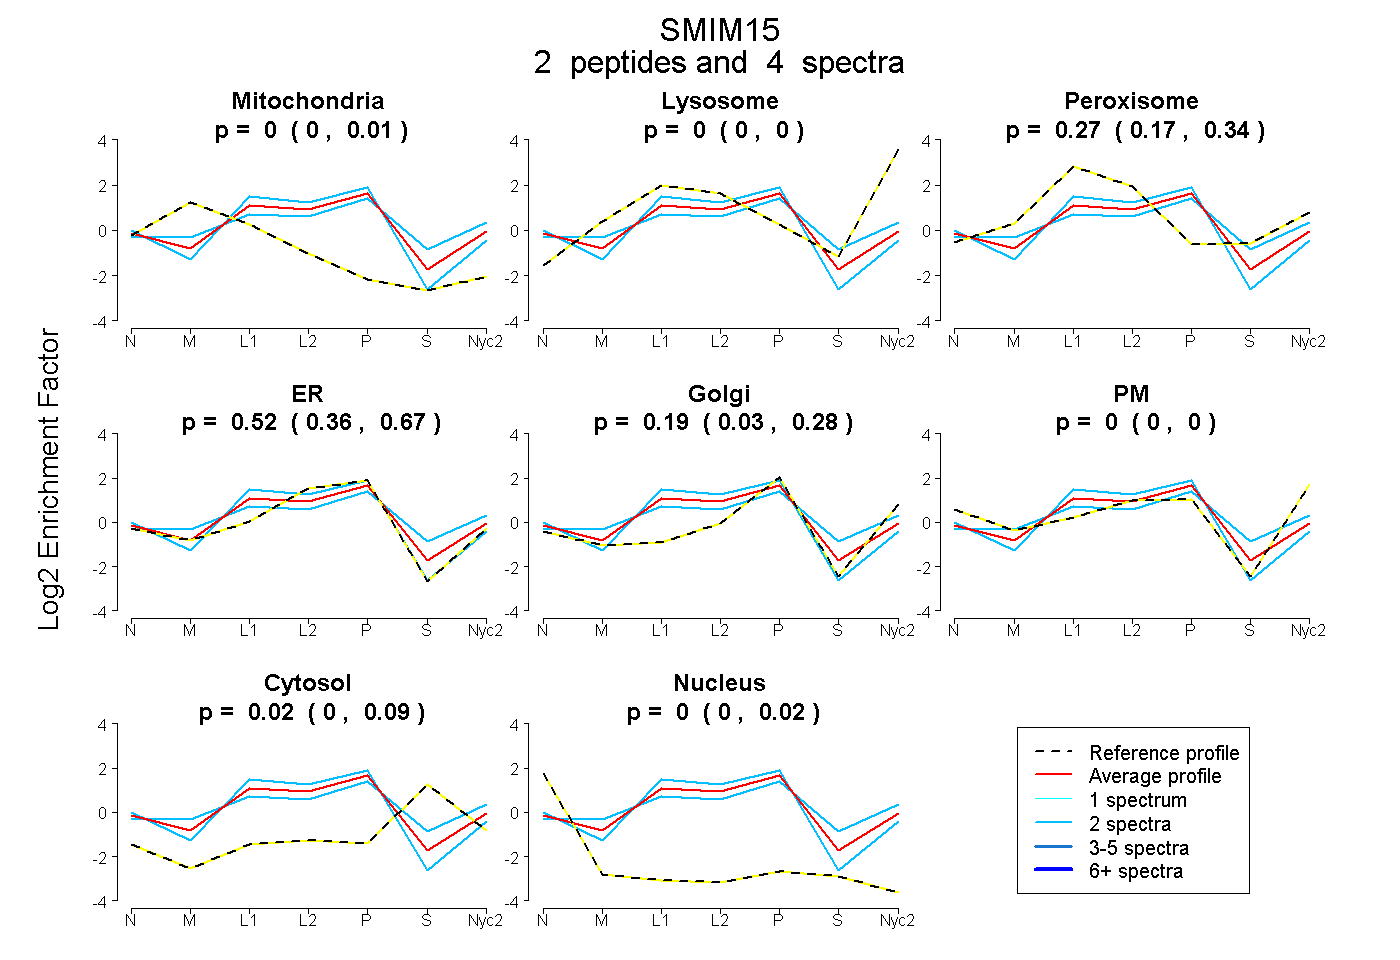
| Expt A |
2 peptides |
4 spectra |
|
0.000 0.000 | 0.013 |
0.000 0.000 | 0.000 |
0.272 0.173 | 0.337 |
0.524 0.363 | 0.673 |
0.186 0.032 | 0.278 |
0.000 0.000 | 0.000 |
0.018 0.000 | 0.089 |
0.000 0.000 | 0.023 |
| 2 spectra, QENIAK | 0.000 | 0.000 | 0.152 | 0.848 | 0.000 | 0.000 | 0.000 | 0.000 | ||
| 2 spectra, AWAEYVVEWAAK | 0.000 | 0.000 | 0.385 | 0.093 | 0.451 | 0.000 | 0.071 | 0.000 |
| Plot | Lyso | Other | |||||||||||
| Expt C |
1 peptide |
2 spectra |
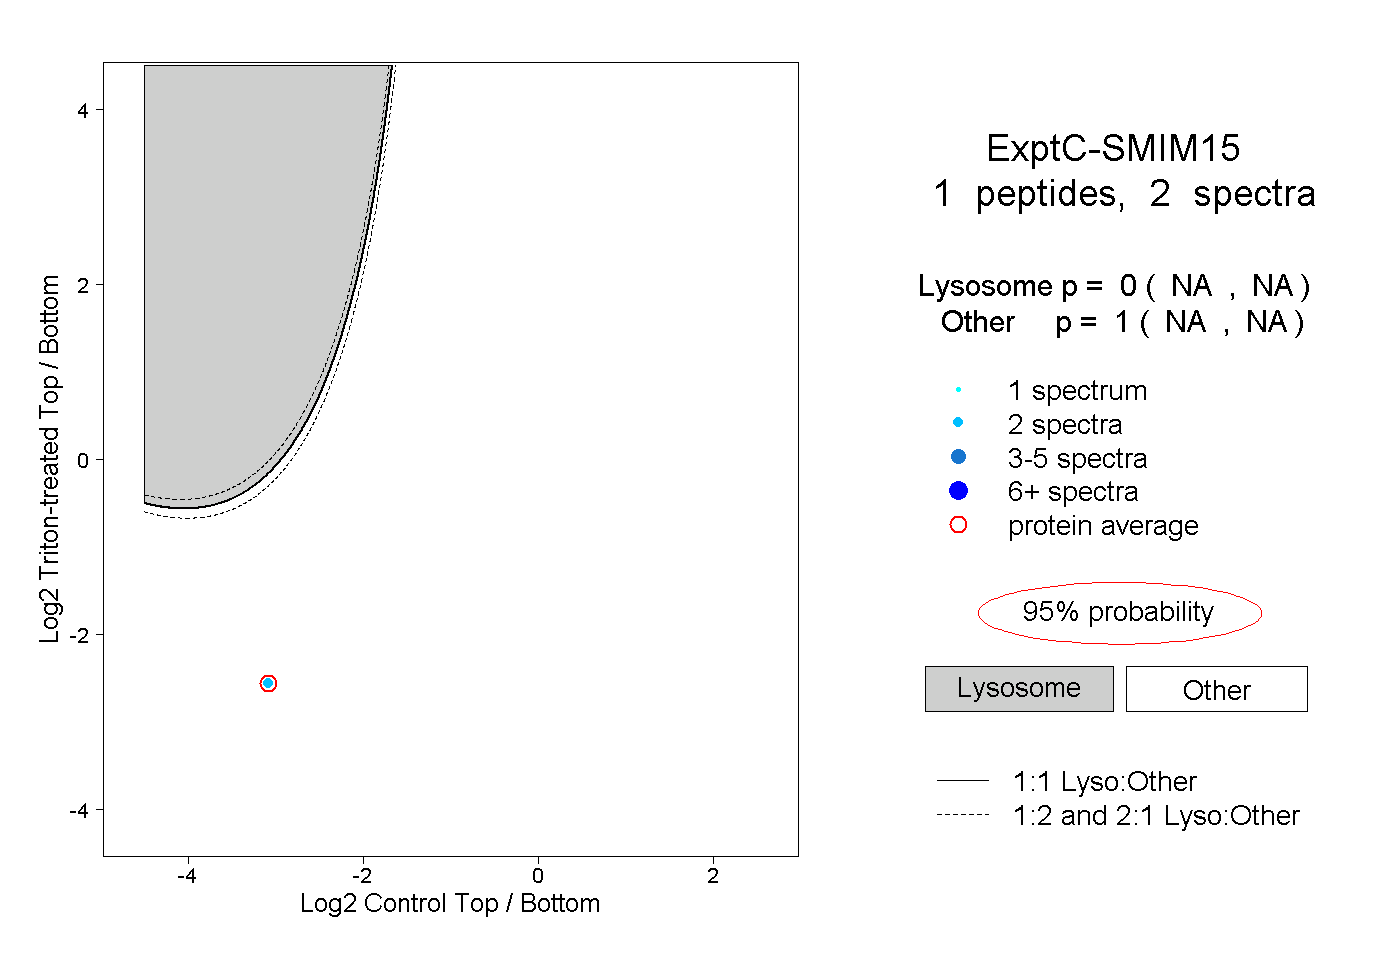 |
0.000 NA | NA |
1.000 NA | NA |