 4
4peptides
spectra
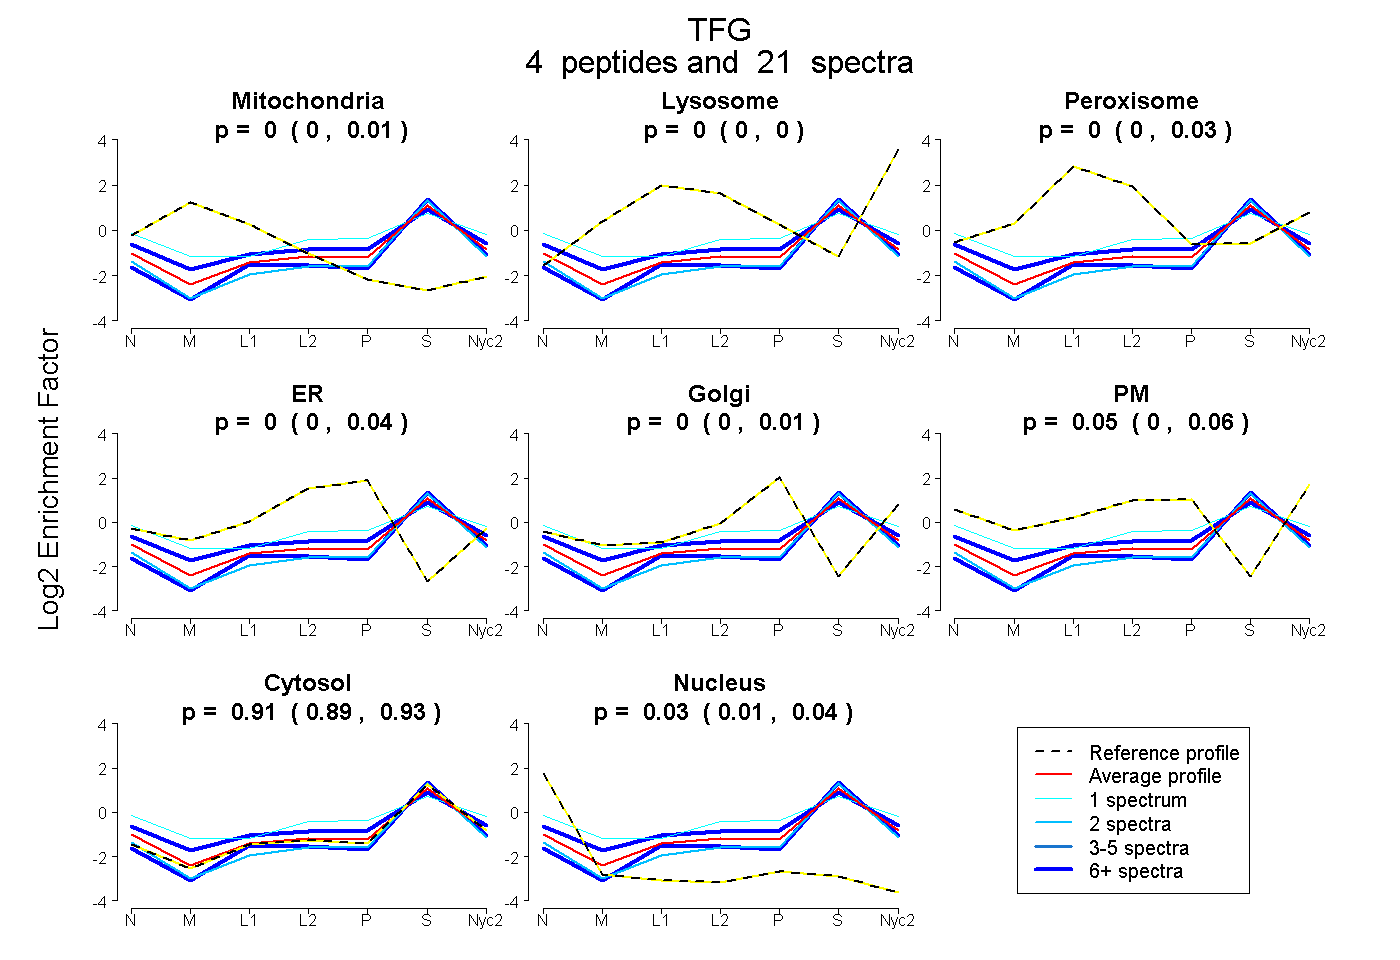
0.000 | 0.009
0.000 | 0.000
0.000 | 0.029
0.000 | 0.036
0.000 | 0.006
0.004 | 0.063
0.889 | 0.931
0.007 | 0.044
2peptides
spectra
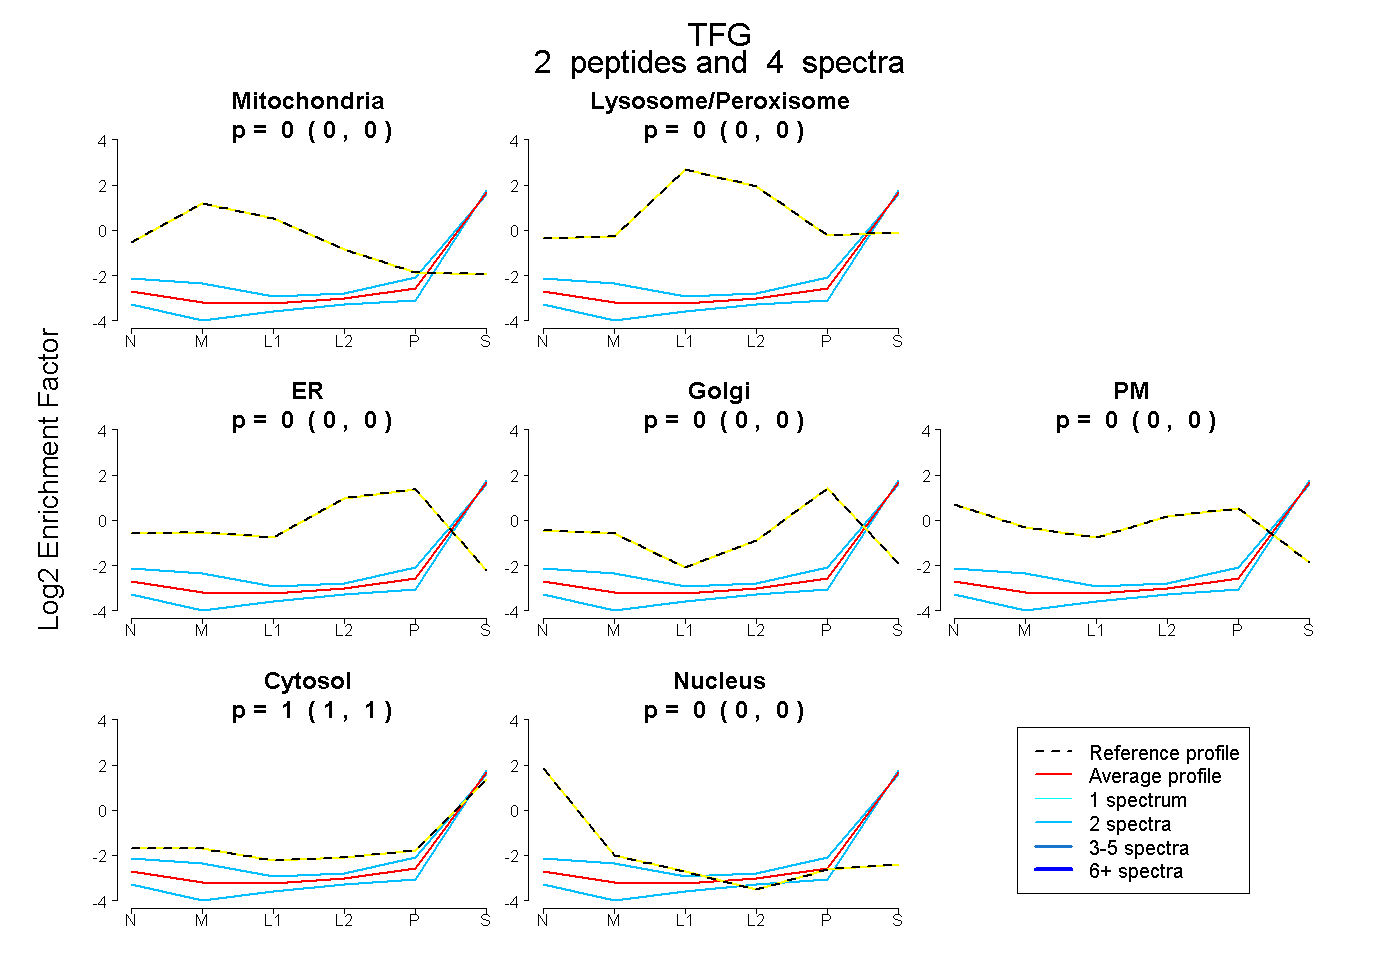
0.000 | 0.000
0.000 | 0.000
0.000 | 0.000
0.000 | 0.000
0.000 | 0.000
1.000 | 1.000
0.000 | 0.000
5peptides
spectra
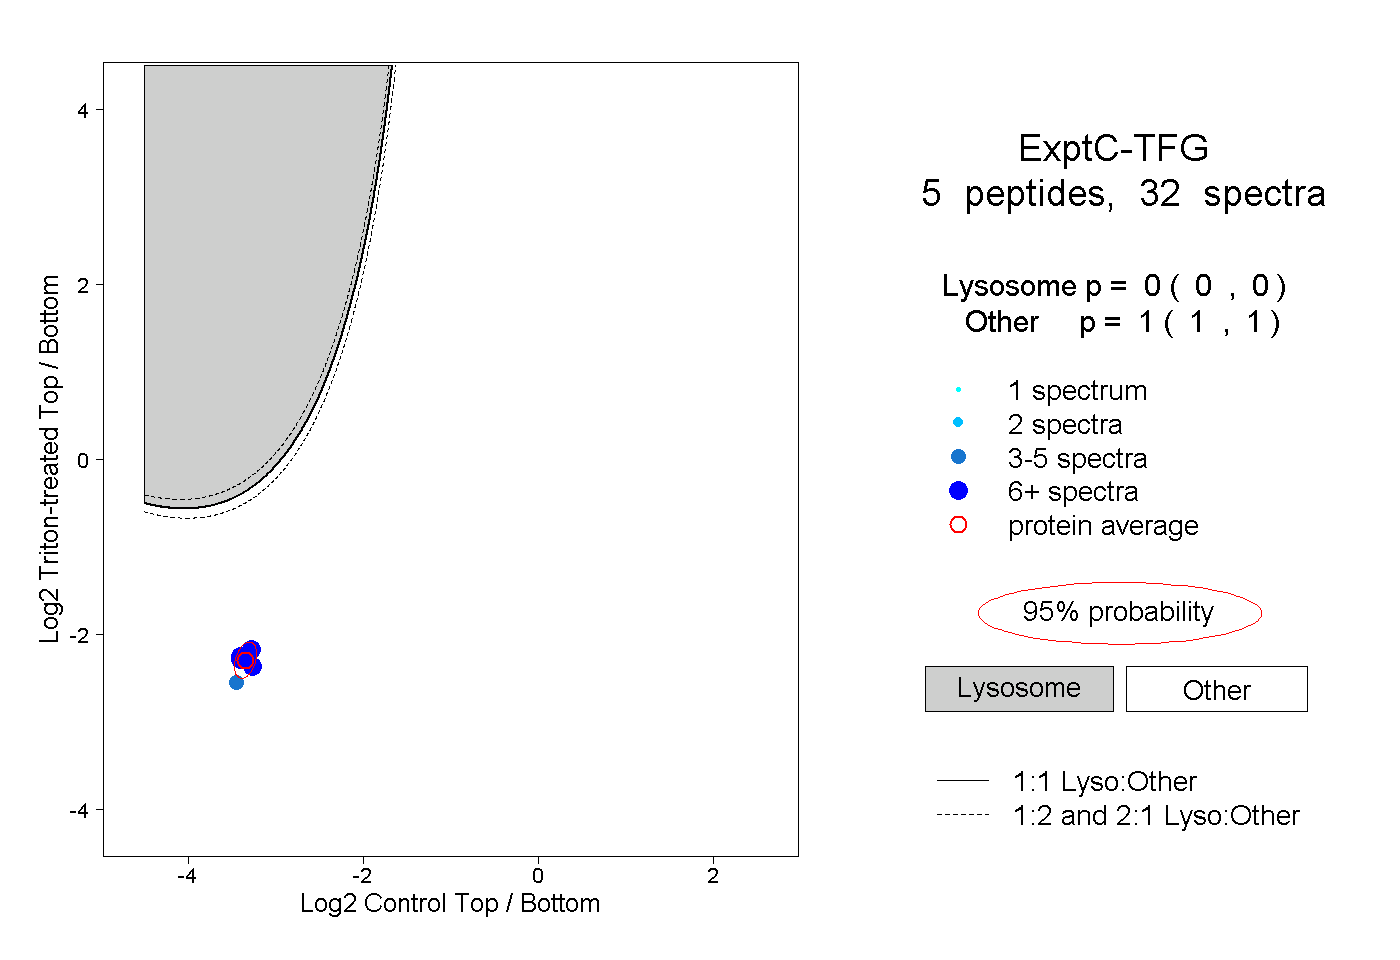
0.000 | 0.000
1.000 | 1.000
2peptides
spectra
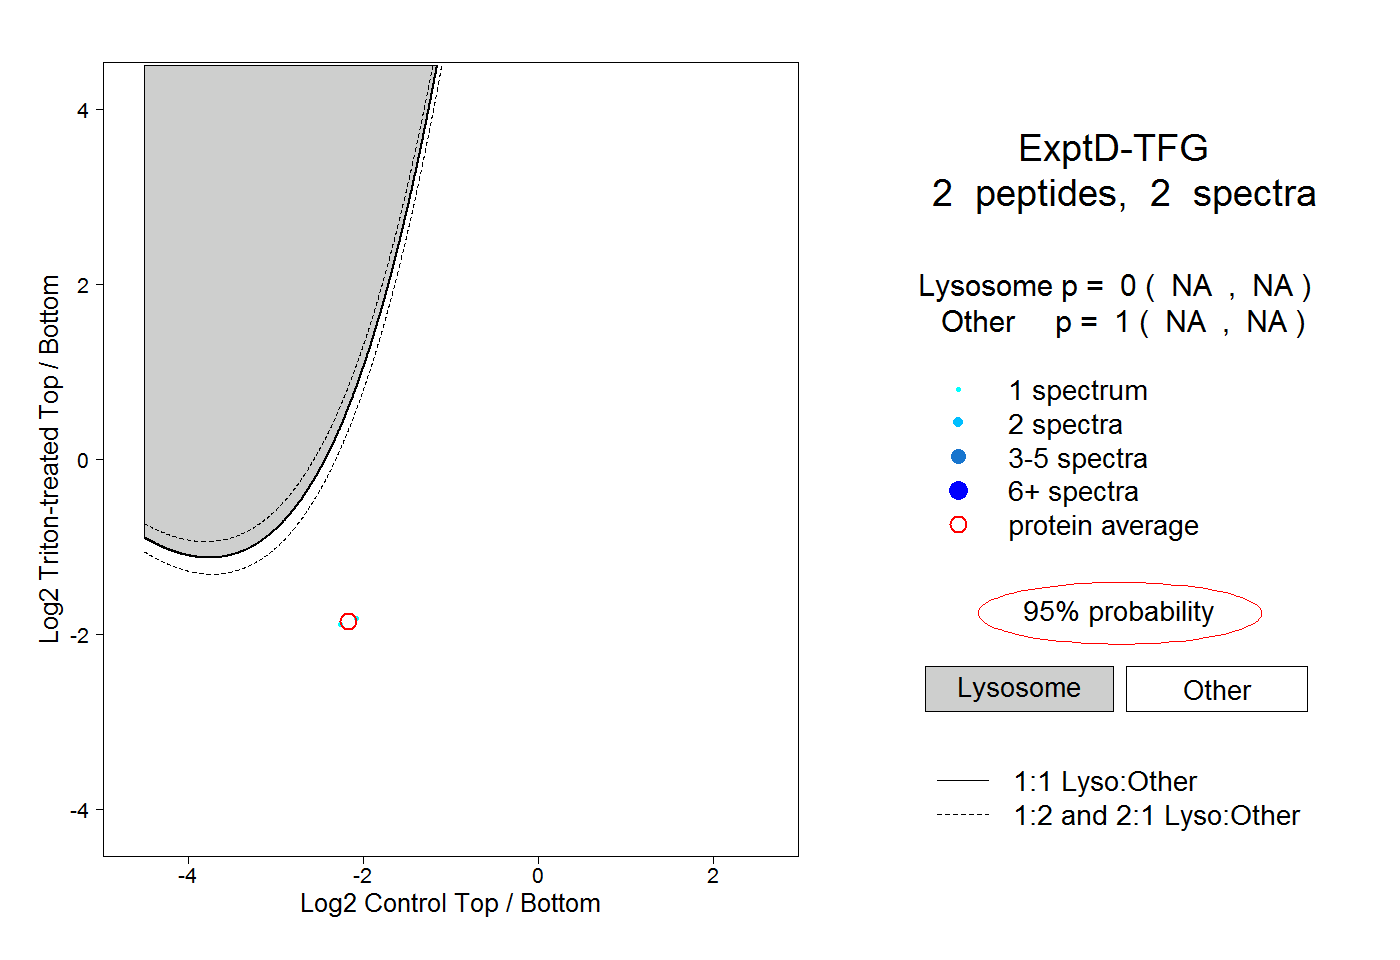
NA | NA
NA | NA