 11
11peptides
spectra
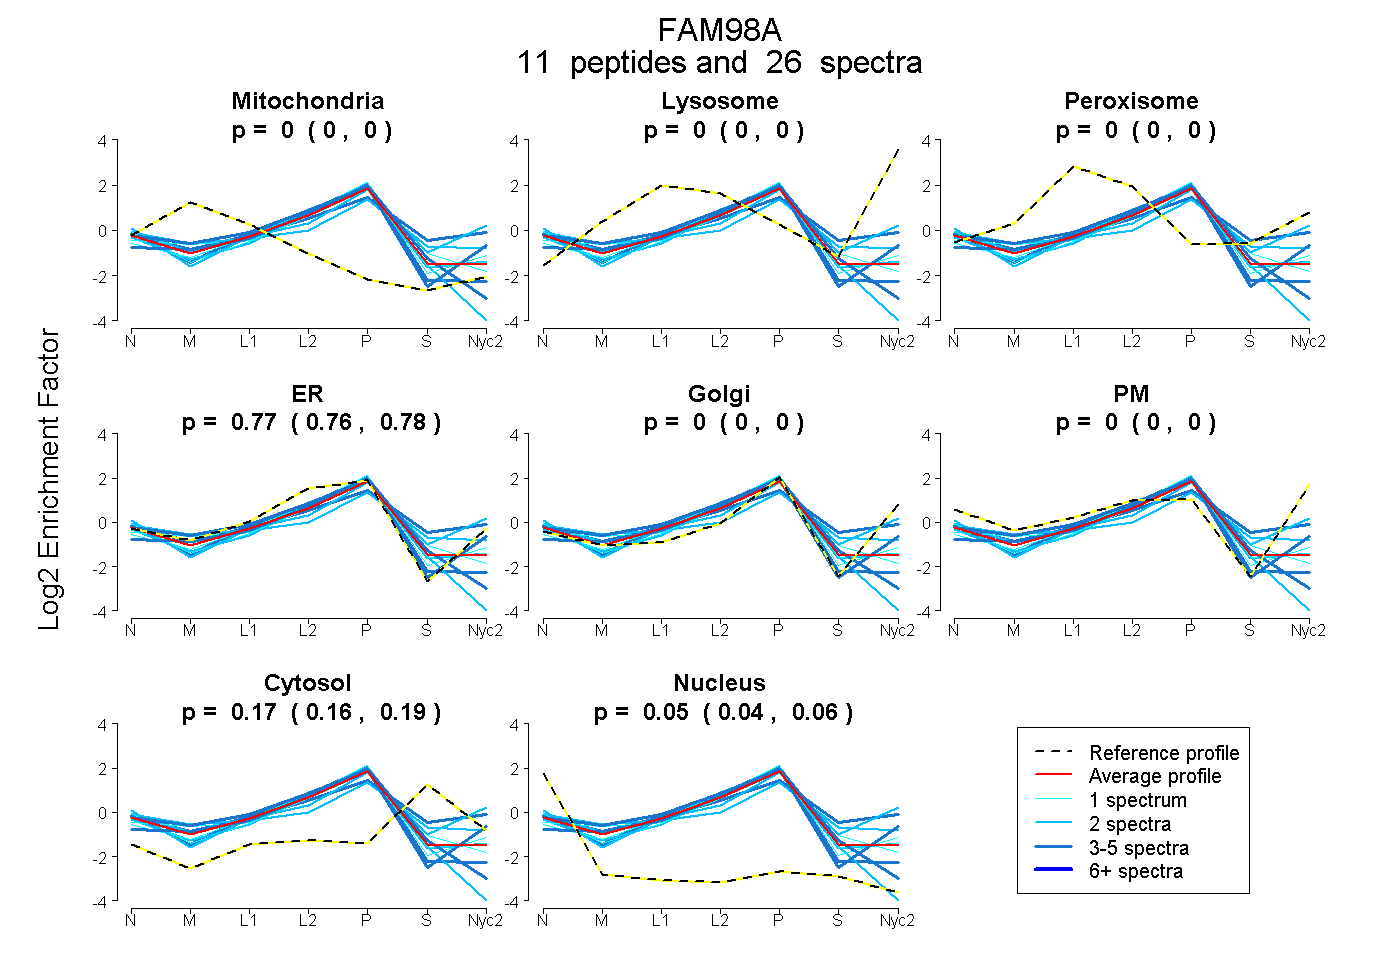
0.000 | 0.000
0.000 | 0.000
0.000 | 0.000
0.765 | 0.781
0.000 | 0.000
0.000 | 0.000
0.159 | 0.186
0.040 | 0.063
4peptides
spectra
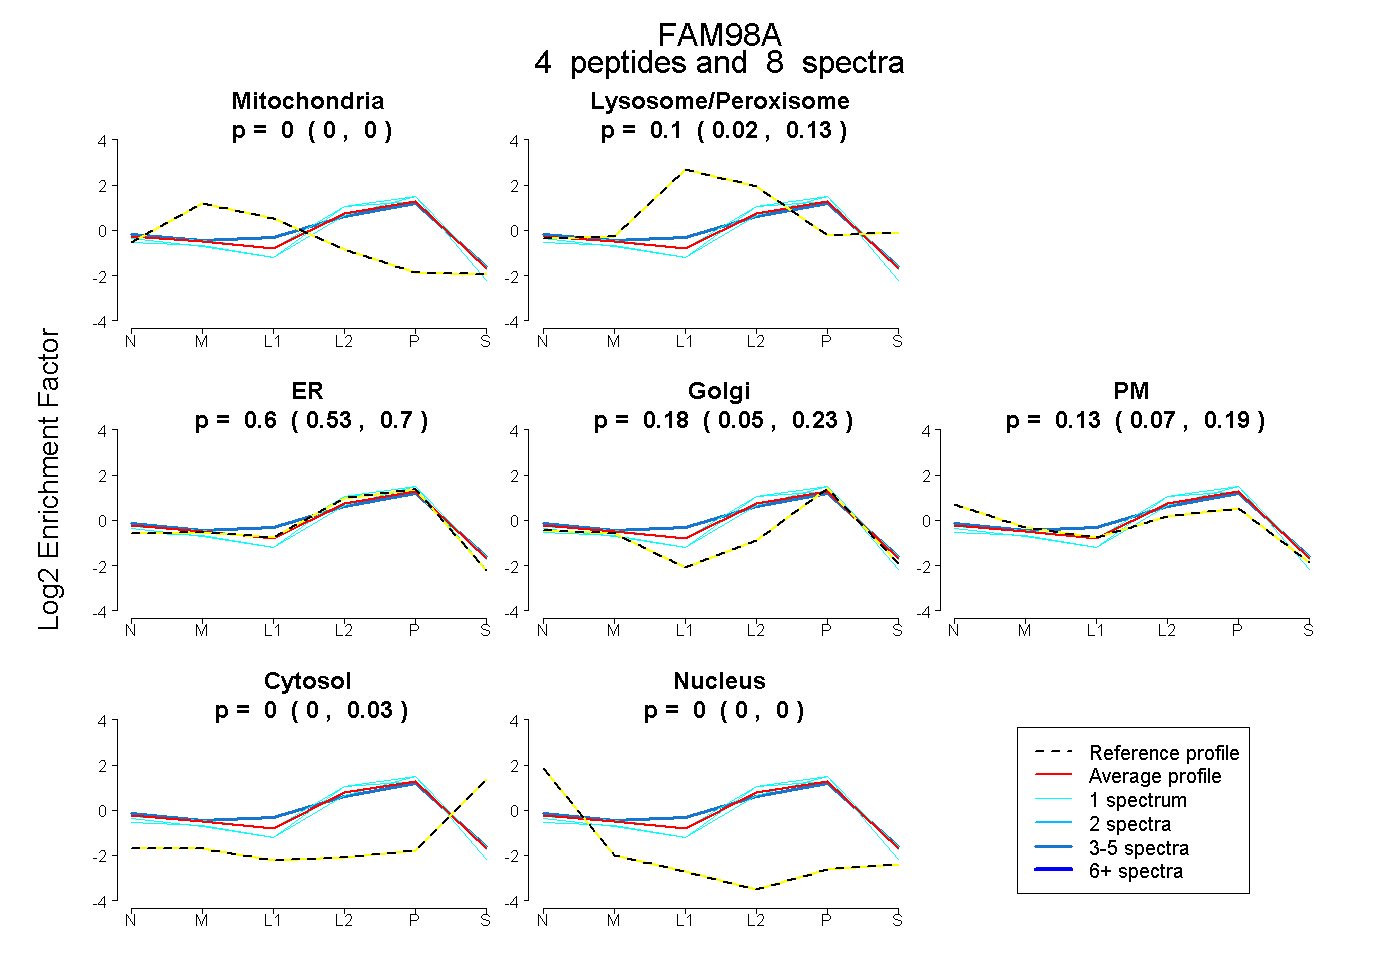
0.000 | 0.000
0.021 | 0.131
0.528 | 0.704
0.054 | 0.226
0.066 | 0.190
0.000 | 0.030
0.000 | 0.000
8peptides
spectra
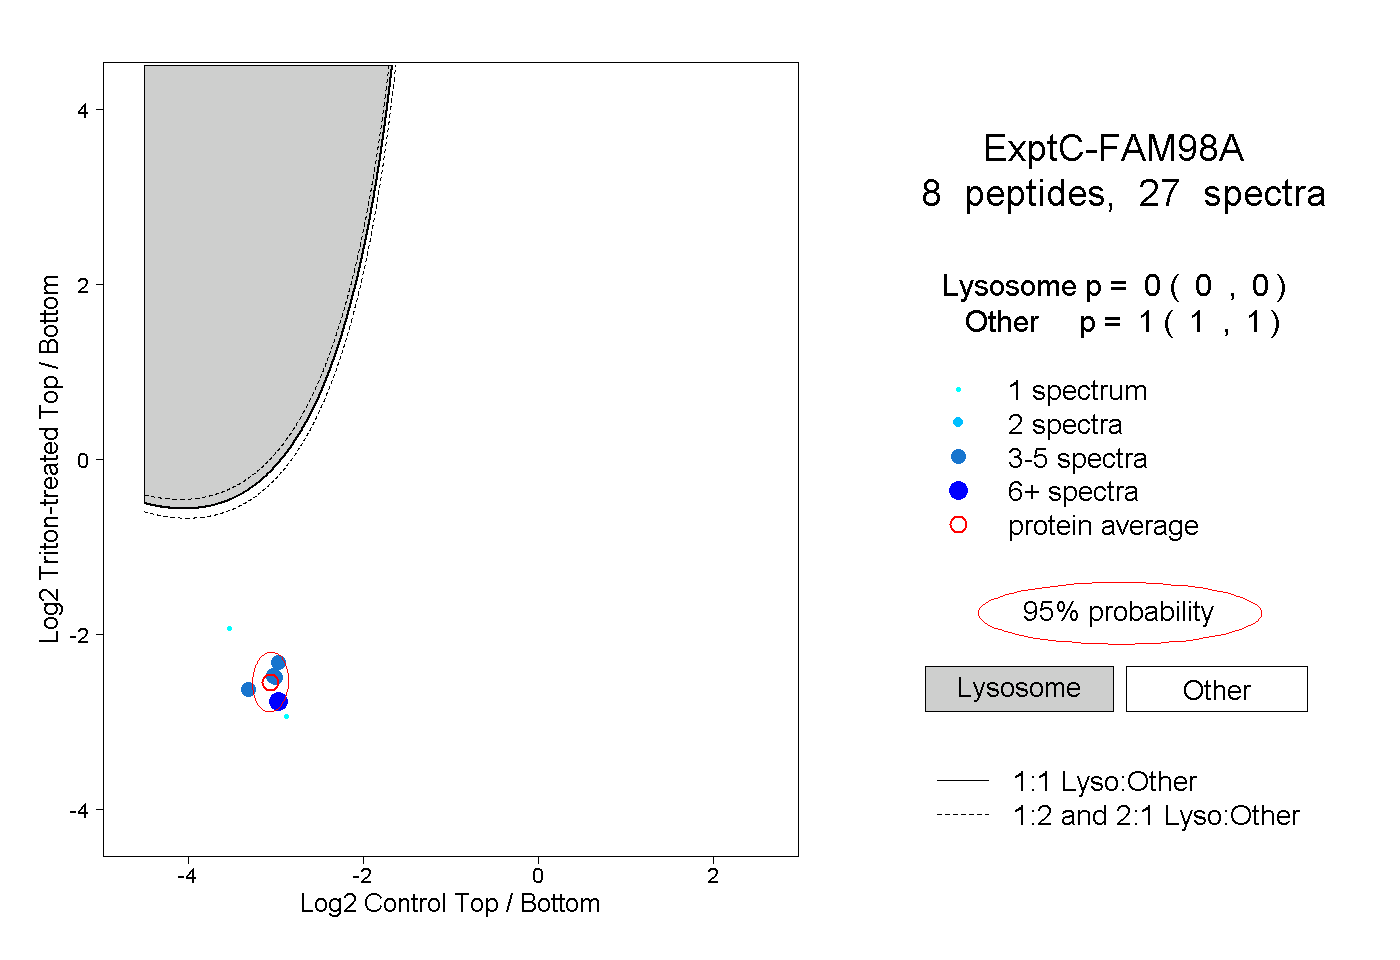
0.000 | 0.000
1.000 | 1.000