 27
27peptides
spectra
0.000 | 0.000
0.365 | 0.370
0.629 | 0.635
0.000 | 0.000
0.000 | 0.000
0.000 | 0.000
0.000 | 0.000
0.000 | 0.000
| Plot | Mito | Lyso | Perox | ER | Golgi | PM | Cytosol | Nucleus | |||||
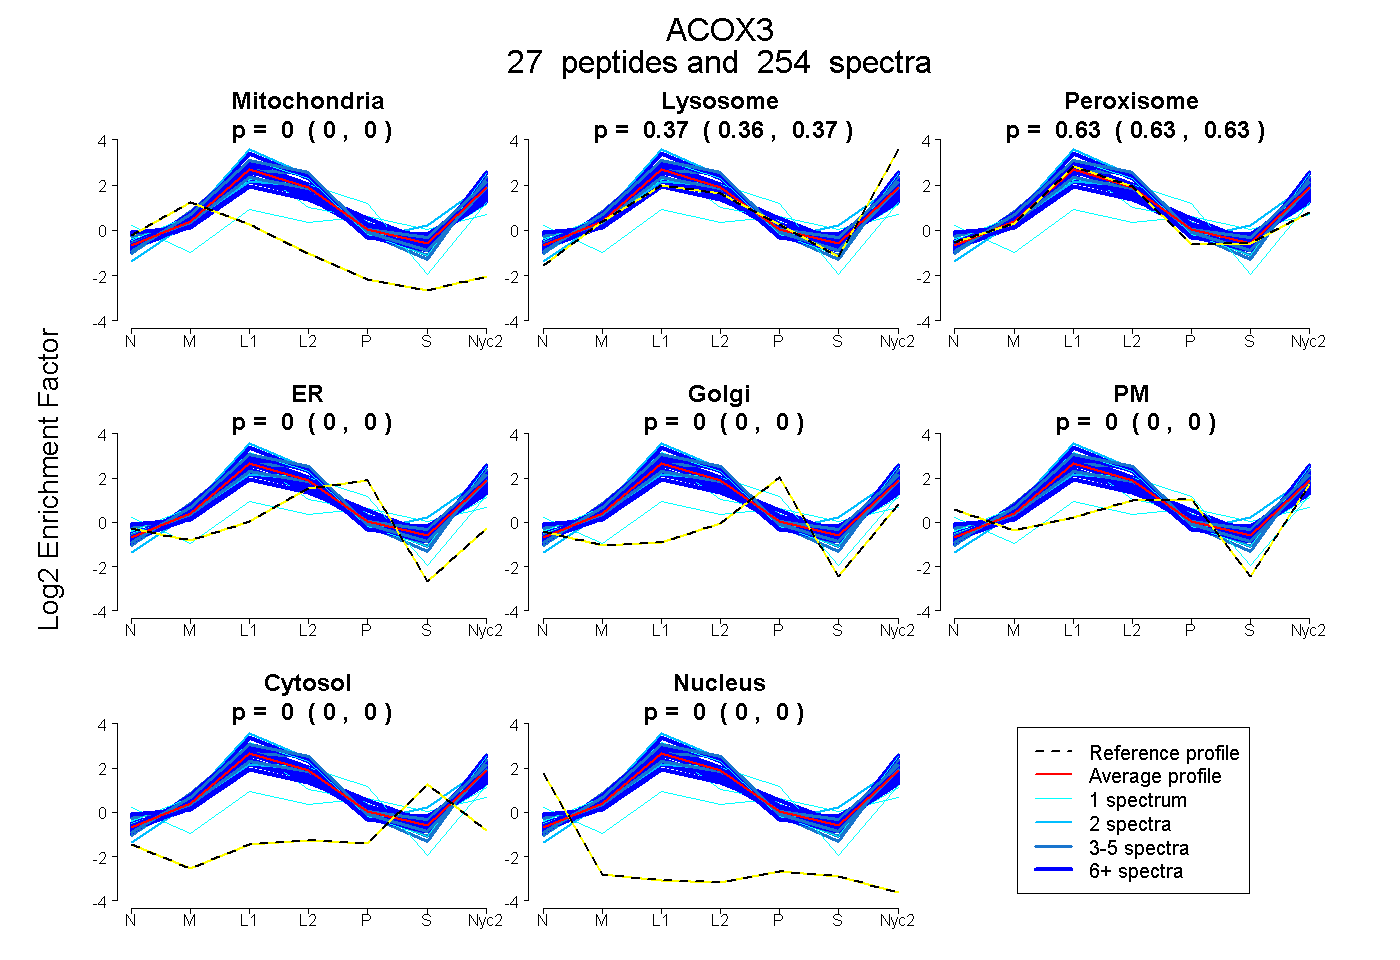
| Expt A |
27 peptides |
254 spectra |
|
0.000 0.000 | 0.000 |
0.368 0.365 | 0.370 |
0.632 0.629 | 0.635 |
0.000 0.000 | 0.000 |
0.000 0.000 | 0.000 |
0.000 0.000 | 0.000 |
0.000 0.000 | 0.000 |
0.000 0.000 | 0.000 |
| 1 spectrum, TIFSTLENDPLFARPFGADLPLEK | 0.000 | 0.471 | 0.529 | 0.000 | 0.000 | 0.000 | 0.000 | 0.000 | ||
| 4 spectra, NLWAAVLQQSGVLER | 0.000 | 0.512 | 0.488 | 0.000 | 0.000 | 0.000 | 0.000 | 0.000 | ||
| 16 spectra, TIFLDLIELQR | 0.000 | 0.518 | 0.482 | 0.000 | 0.000 | 0.000 | 0.000 | 0.000 | ||
| 2 spectra, EIHALASAGKPLASWTAQR | 0.000 | 0.385 | 0.615 | 0.000 | 0.000 | 0.000 | 0.000 | 0.000 | ||
| 2 spectra, ELDFIR | 0.000 | 0.394 | 0.606 | 0.000 | 0.000 | 0.000 | 0.000 | 0.000 | ||
| 1 spectrum, AMEDAILMLCVQLK | 0.000 | 0.000 | 0.360 | 0.000 | 0.096 | 0.275 | 0.269 | 0.000 | ||
| 11 spectra, GLHSFLVQIR | 0.000 | 0.240 | 0.644 | 0.056 | 0.030 | 0.000 | 0.031 | 0.000 | ||
| 13 spectra, ADWLDSEAPLAAYR | 0.000 | 0.368 | 0.632 | 0.000 | 0.000 | 0.000 | 0.000 | 0.000 | ||
| 11 spectra, GGYISGEQTGK | 0.000 | 0.405 | 0.595 | 0.000 | 0.000 | 0.000 | 0.000 | 0.000 | ||
| 2 spectra, LAVIIAIR | 0.000 | 0.454 | 0.479 | 0.000 | 0.000 | 0.000 | 0.067 | 0.000 | ||
| 12 spectra, VFEYGFFNAEDMLK | 0.000 | 0.329 | 0.671 | 0.000 | 0.000 | 0.000 | 0.000 | 0.000 | ||
| 12 spectra, TLLPMPGVMVGDMGK | 0.000 | 0.237 | 0.487 | 0.000 | 0.000 | 0.237 | 0.039 | 0.000 | ||
| 5 spectra, LGQNGLDNGFAMFHK | 0.000 | 0.503 | 0.465 | 0.000 | 0.000 | 0.032 | 0.000 | 0.000 | ||
| 11 spectra, GIQECR | 0.000 | 0.286 | 0.680 | 0.029 | 0.000 | 0.005 | 0.000 | 0.000 | ||
| 29 spectra, LGASLGSLSSGR | 0.000 | 0.477 | 0.523 | 0.000 | 0.000 | 0.000 | 0.000 | 0.000 | ||
| 1 spectrum, NNSQVYGCRPLALAFMELTVMQR | 0.000 | 0.291 | 0.345 | 0.363 | 0.000 | 0.000 | 0.000 | 0.000 | ||
| 6 spectra, AAWWPEFTANK | 0.000 | 0.204 | 0.796 | 0.000 | 0.000 | 0.000 | 0.000 | 0.000 | ||
| 27 spectra, GPLSAYR | 0.000 | 0.479 | 0.497 | 0.000 | 0.016 | 0.009 | 0.000 | 0.000 | ||
| 6 spectra, DSVLWSDIPK | 0.000 | 0.183 | 0.817 | 0.000 | 0.000 | 0.000 | 0.000 | 0.000 | ||
| 1 spectrum, FMASSK | 0.000 | 0.093 | 0.780 | 0.000 | 0.127 | 0.000 | 0.000 | 0.000 | ||
| 16 spectra, GSDFEAR | 0.000 | 0.296 | 0.603 | 0.000 | 0.012 | 0.081 | 0.008 | 0.000 | ||
| 10 spectra, QNLLDR | 0.000 | 0.407 | 0.593 | 0.000 | 0.000 | 0.000 | 0.000 | 0.000 | ||
| 21 spectra, EACGGHGYLAMNR | 0.000 | 0.147 | 0.645 | 0.000 | 0.000 | 0.179 | 0.029 | 0.000 | ||
| 5 spectra, YCQEK | 0.000 | 0.356 | 0.644 | 0.000 | 0.000 | 0.000 | 0.000 | 0.000 | ||
| 5 spectra, TVNFLEAYPGILGQK | 0.000 | 0.422 | 0.549 | 0.000 | 0.000 | 0.022 | 0.007 | 0.000 | ||
| 15 spectra, FWVGNLGK | 0.000 | 0.365 | 0.635 | 0.000 | 0.000 | 0.000 | 0.000 | 0.000 | ||
| 9 spectra, ASFNSK | 0.000 | 0.286 | 0.634 | 0.000 | 0.000 | 0.000 | 0.079 | 0.000 |
| Plot | Mito | Lyso or Perox | ER | Golgi | PM | Cytosol | Nucleus | ||||||
| Expt B |
29 peptides |
165 spectra |
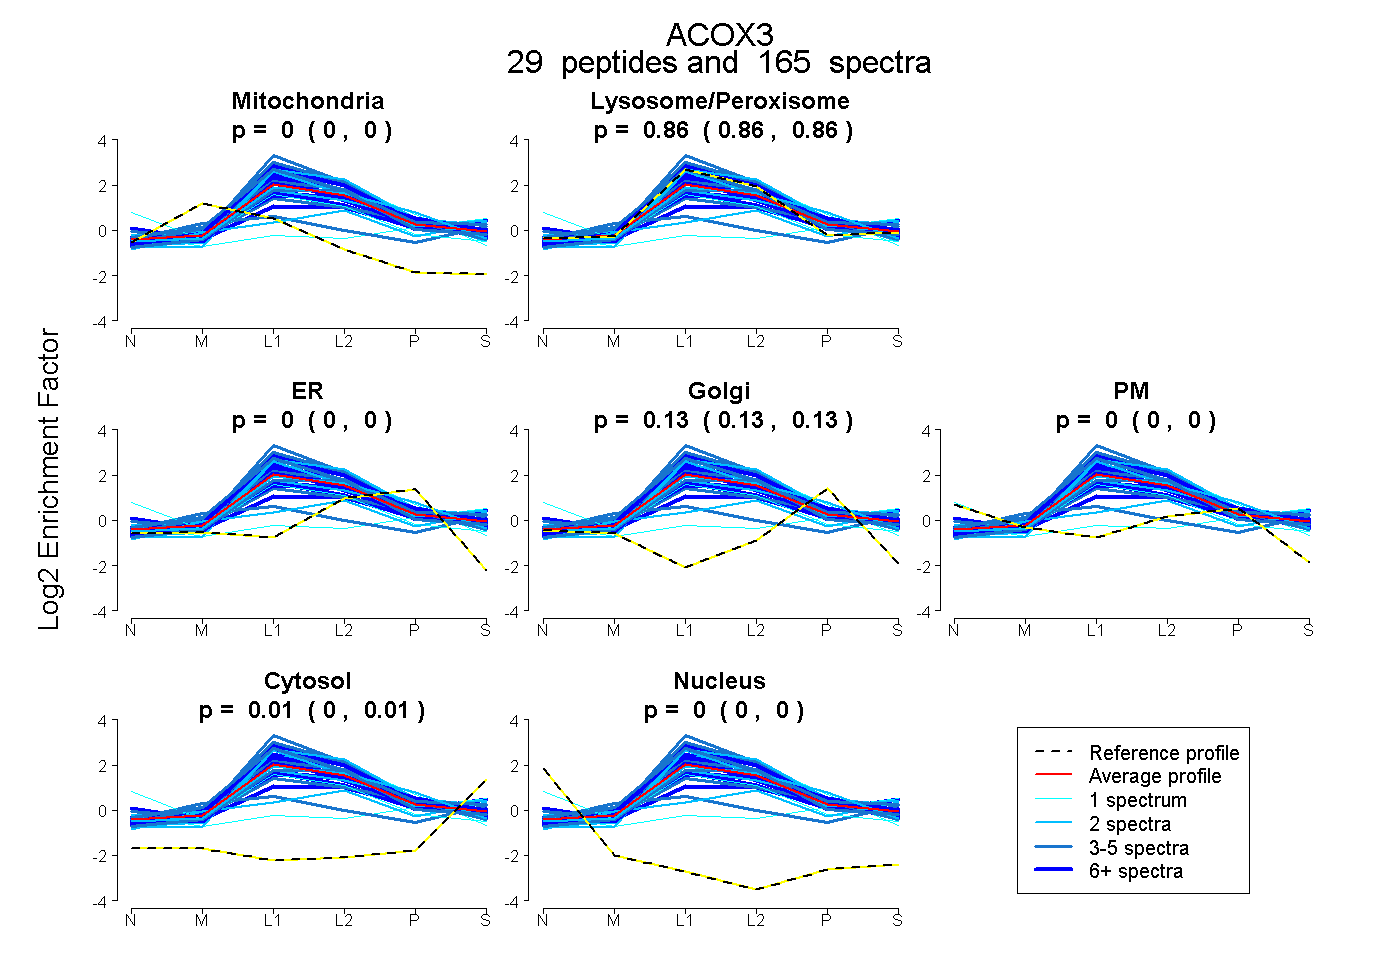 |
0.000 0.000 | 0.000 |
0.862 0.859 | 0.865 |
0.000 0.000 | 0.000 |
0.132 0.129 | 0.134 |
0.000 0.000 | 0.000 |
0.006 0.004 | 0.007 |
0.000 0.000 | 0.000 |
|||
| Plot | Lyso | Other | |||||||||||
| Expt C |
36 peptides |
1436 spectra |
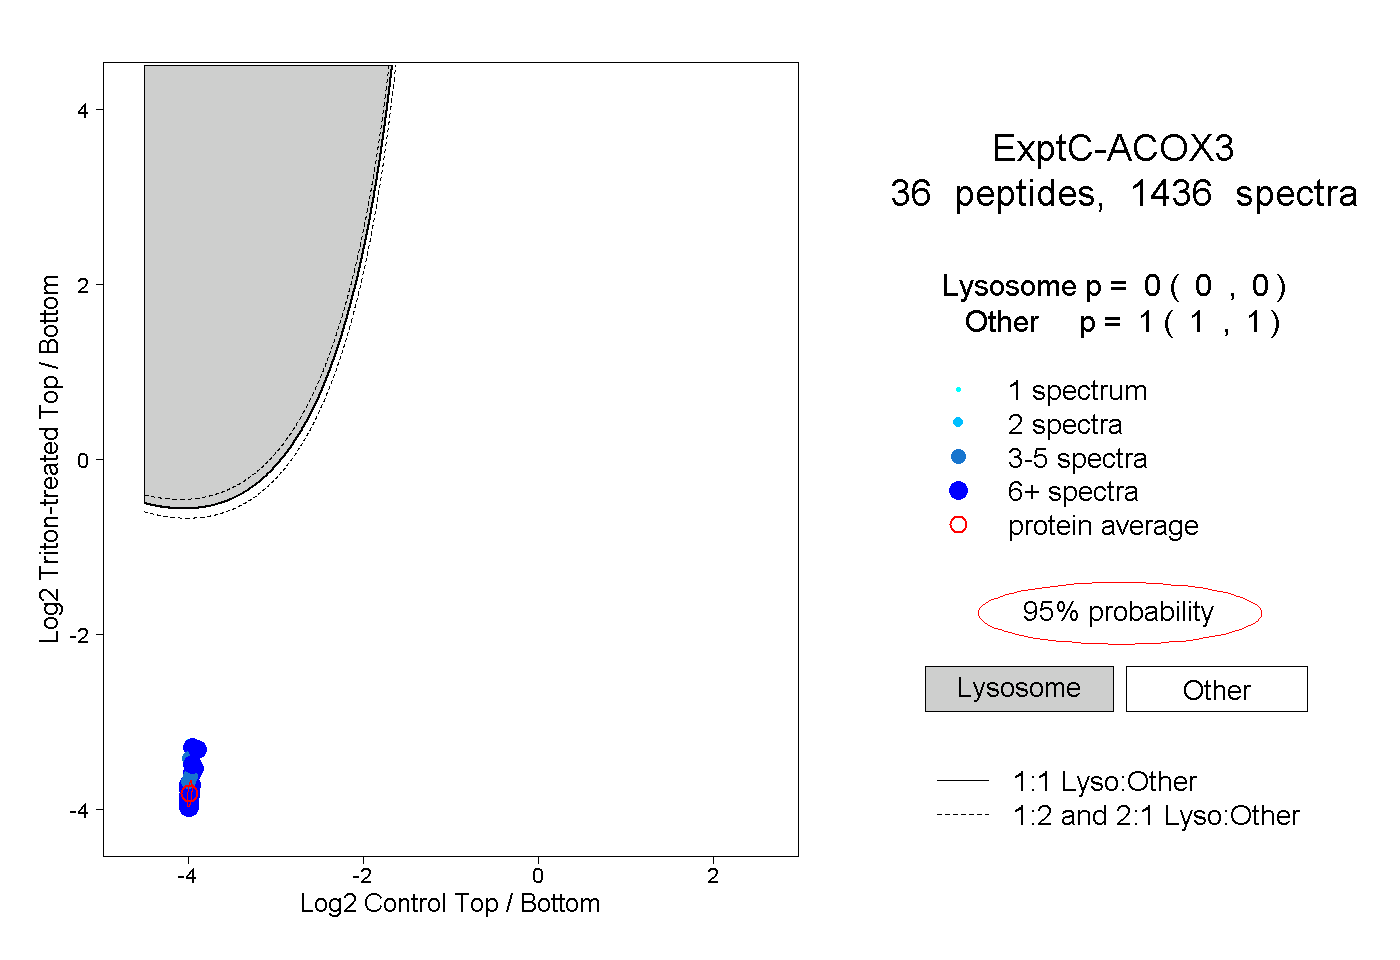 |
0.000 0.000 | 0.000 |
1.000 1.000 | 1.000 |
||||||||
| Plot | Lyso | Other | |||||||||||
| Expt D |
24 peptides |
125 spectra |
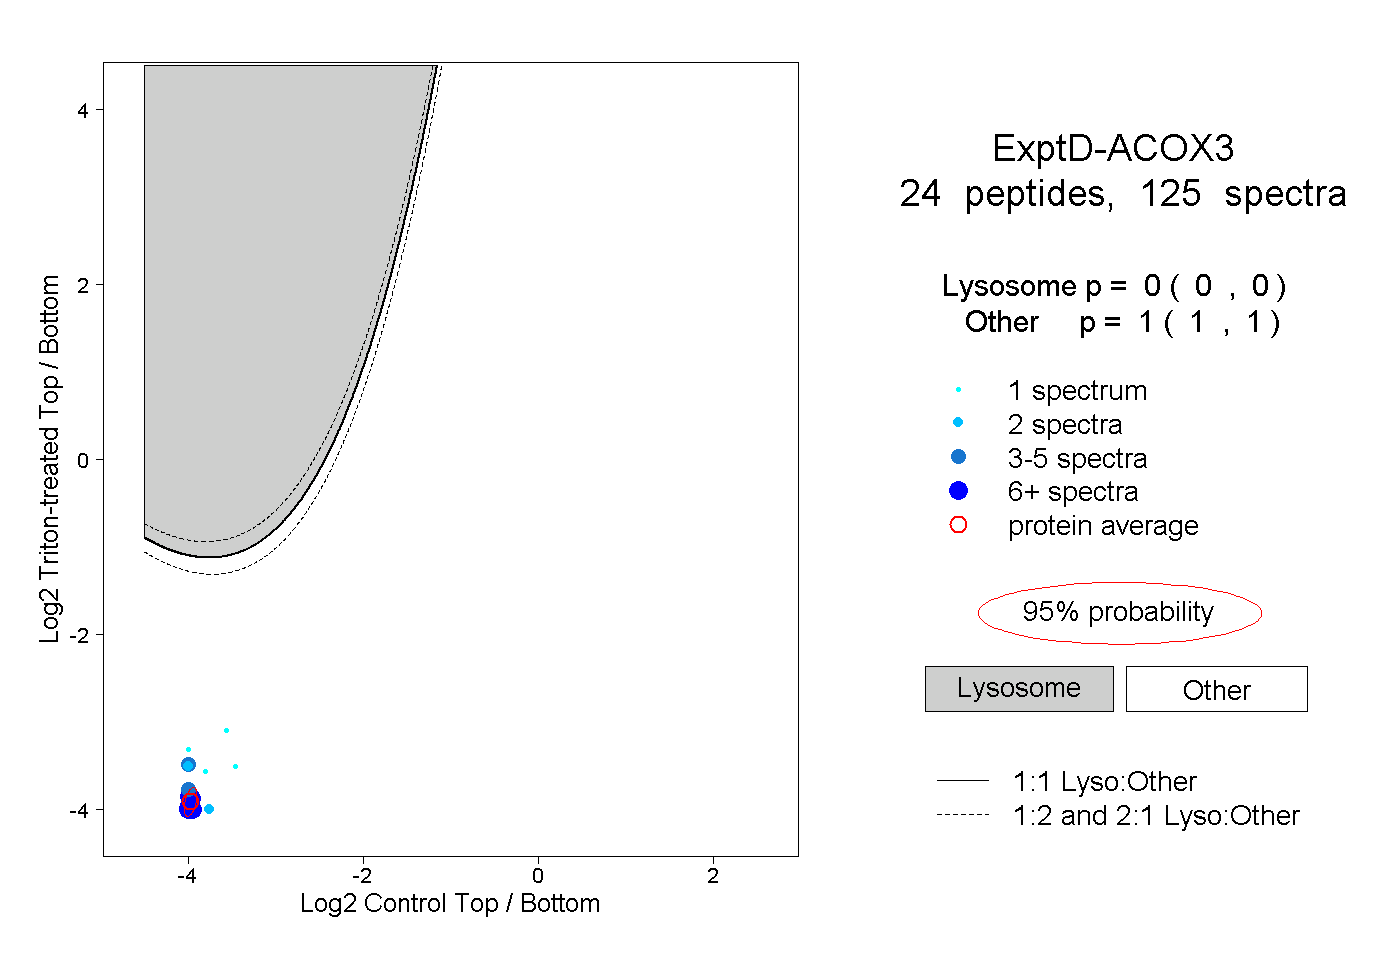 |
0.000 0.000 | 0.000 |
1.000 1.000 | 1.000 |