 4
4peptides
spectra
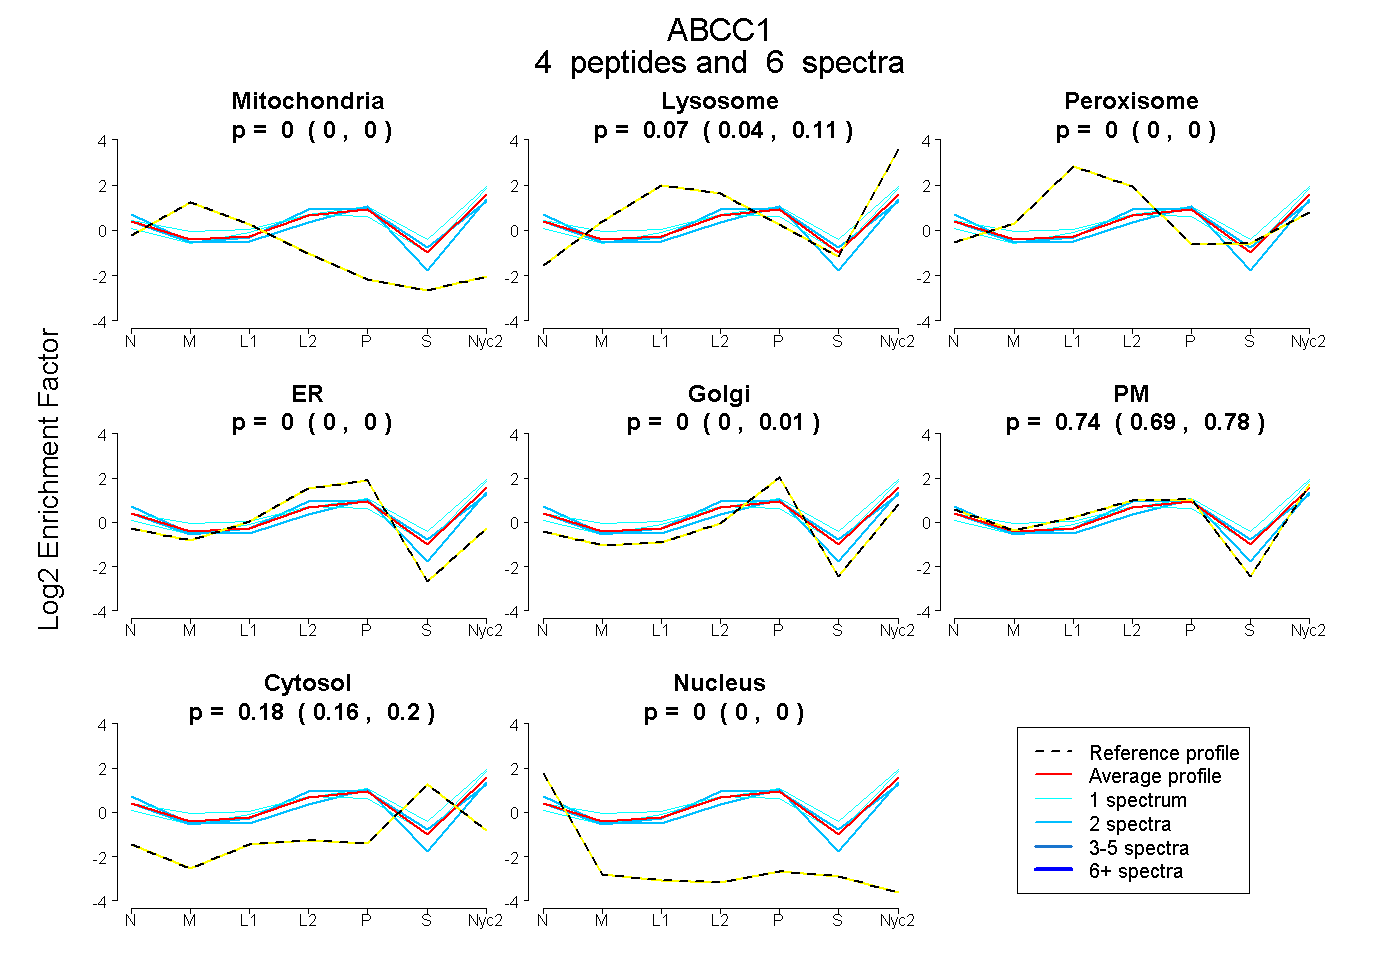
0.000 | 0.000
0.037 | 0.105
0.000 | 0.000
0.000 | 0.000
0.000 | 0.015
0.691 | 0.782
0.158 | 0.205
0.000 | 0.000
| Plot | Mito | Lyso | Perox | ER | Golgi | PM | Cytosol | Nucleus | |||||
| Expt A |
4 peptides |
6 spectra |
|
0.000 0.000 | 0.000 |
0.075 0.037 | 0.105 |
0.000 0.000 | 0.000 |
0.000 0.000 | 0.000 |
0.000 0.000 | 0.015 |
0.742 0.691 | 0.782 |
0.184 0.158 | 0.205 |
0.000 0.000 | 0.000 |
| 1 spectrum, LHLDLLQNVLR | 0.000 | 0.186 | 0.001 | 0.000 | 0.000 | 0.658 | 0.156 | 0.000 | ||
| 2 spectra, IGLHNLR | 0.000 | 0.034 | 0.033 | 0.000 | 0.000 | 0.721 | 0.213 | 0.000 | ||
| 1 spectrum, AFEEQER | 0.000 | 0.234 | 0.000 | 0.000 | 0.056 | 0.498 | 0.211 | 0.000 | ||
| 2 spectra, ALVITNSAR | 0.000 | 0.000 | 0.000 | 0.000 | 0.138 | 0.742 | 0.093 | 0.027 |