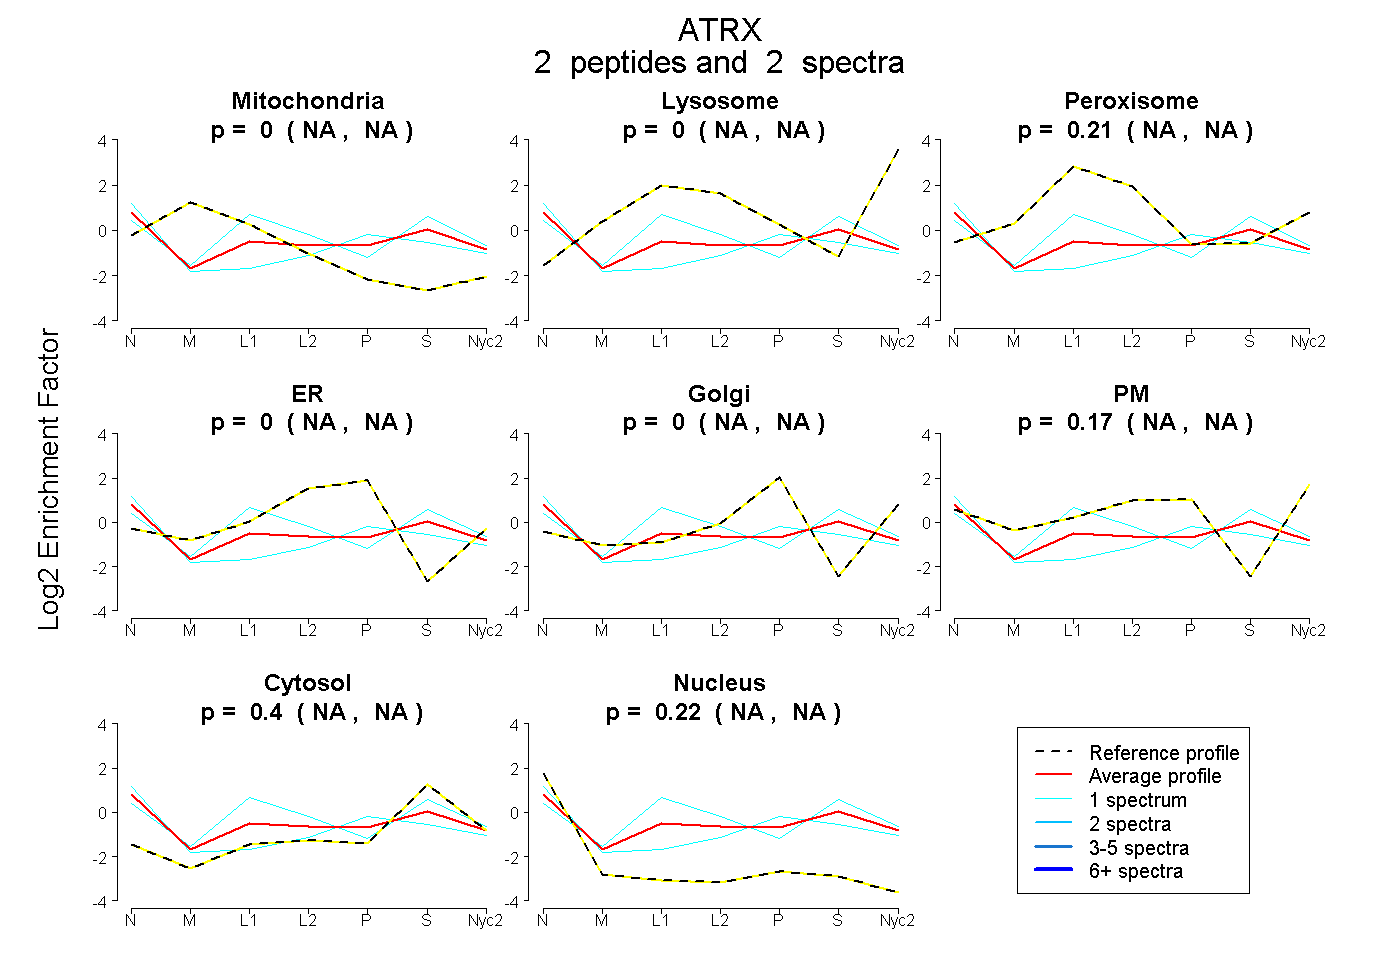
 2
2peptides
spectra
NA | NA
NA | NA
NA | NA
NA | NA
NA | NA
NA | NA
NA | NA
NA | NA
| Plot | Mito | Lyso | Perox | ER | Golgi | PM | Cytosol | Nucleus | |||||
| Expt A |
2 peptides |
2 spectra |
|
0.000 NA | NA |
0.000 NA | NA |
0.209 NA | NA |
0.000 NA | NA |
0.000 NA | NA |
0.171 NA | NA |
0.400 NA | NA |
0.220 NA | NA |
| 1 spectrum, ALDAVHK | 0.000 | 0.000 | 0.000 | 0.000 | 0.088 | 0.270 | 0.342 | 0.300 | ||
| 1 spectrum, IQPLEDIISTVWK | 0.000 | 0.000 | 0.453 | 0.000 | 0.000 | 0.000 | 0.406 | 0.141 |
| Plot | Lyso | Other | |||||||||||
| Expt C |
2 peptides |
2 spectra |
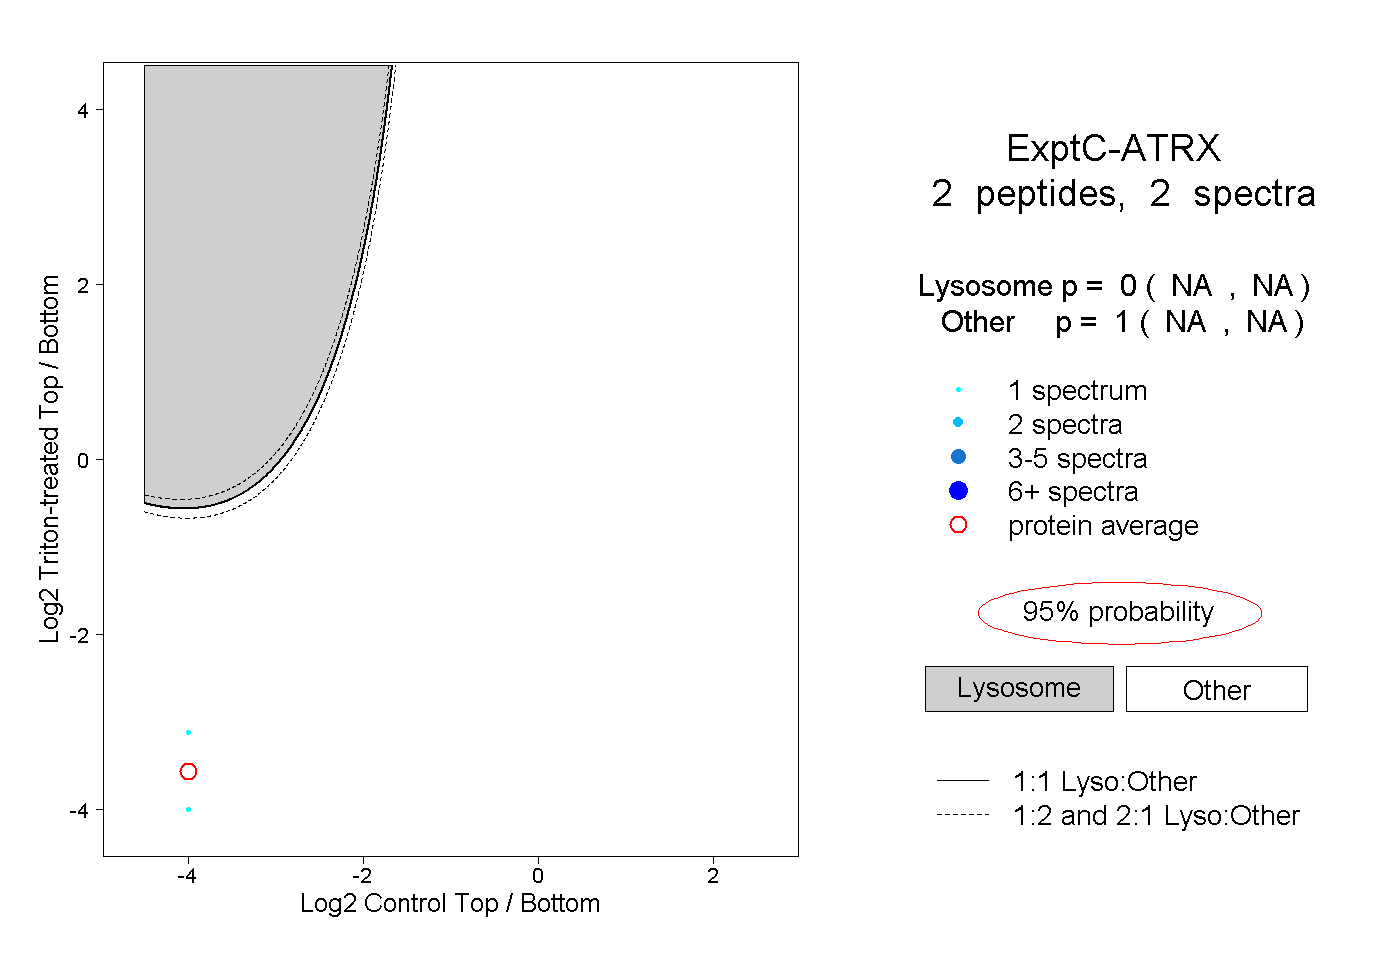 |
0.000 NA | NA |
1.000 NA | NA |