 8
8peptides
spectra
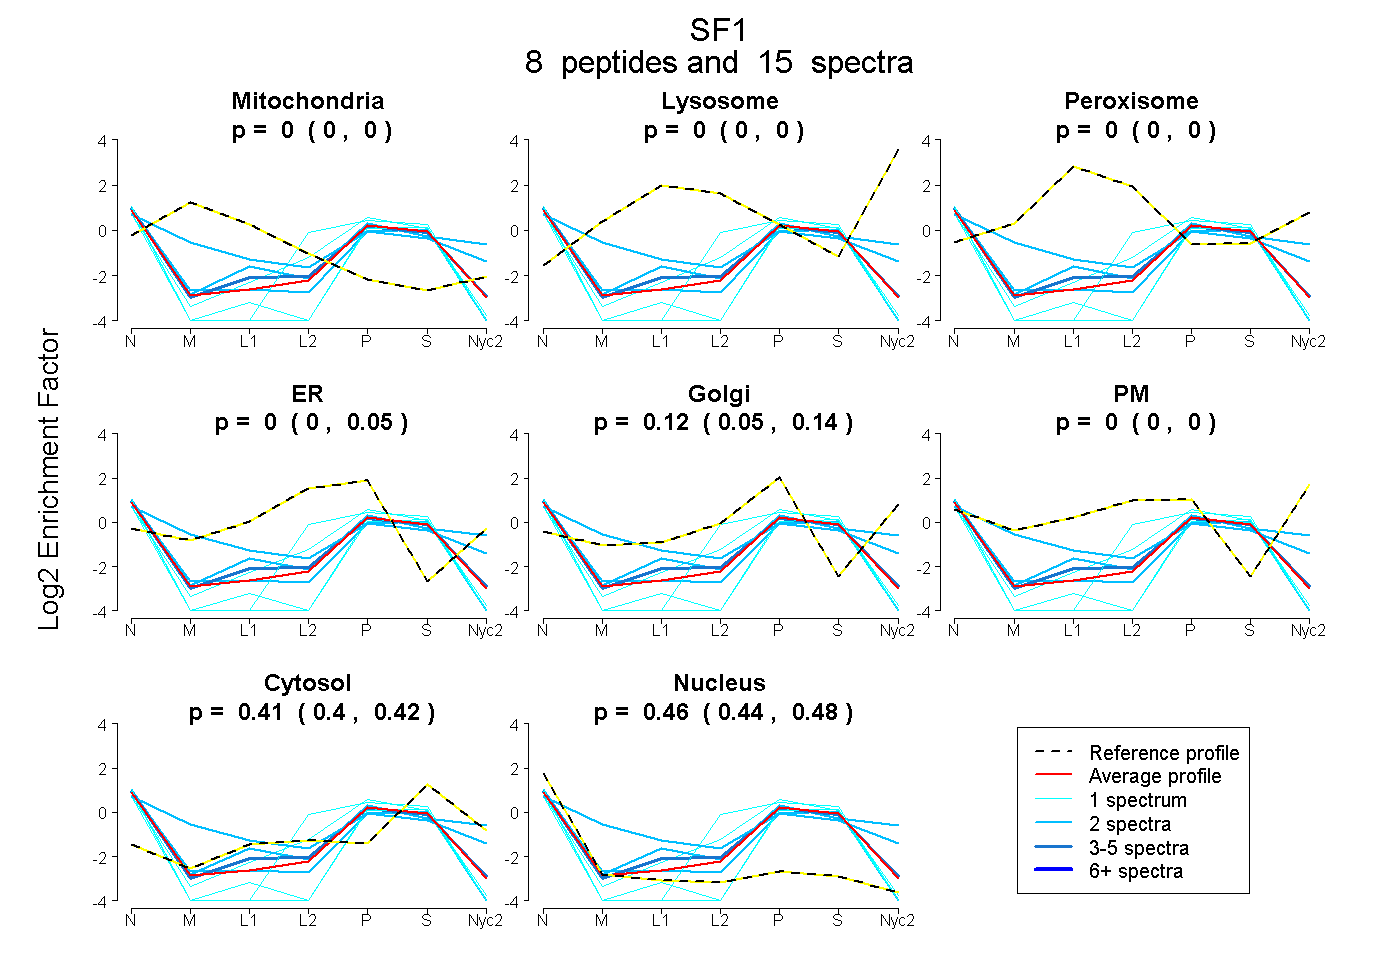
0.000 | 0.000
0.000 | 0.000
0.000 | 0.000
0.000 | 0.053
0.048 | 0.141
0.000 | 0.000
0.402 | 0.423
0.440 | 0.482
| Plot | Mito | Lyso | Perox | ER | Golgi | PM | Cytosol | Nucleus | |||||
| Expt A |
8 peptides |
15 spectra |
|
0.000 0.000 | 0.000 |
0.000 0.000 | 0.000 |
0.000 0.000 | 0.000 |
0.000 0.000 | 0.053 |
0.124 0.048 | 0.141 |
0.000 0.000 | 0.000 |
0.413 0.402 | 0.423 |
0.463 0.440 | 0.482 |
| 2 spectra, WNQDTMEQK | 0.210 | 0.000 | 0.000 | 0.000 | 0.294 | 0.000 | 0.325 | 0.171 | ||
| 2 spectra, AYIVQLQIEDLTR | 0.000 | 0.000 | 0.000 | 0.018 | 0.000 | 0.000 | 0.415 | 0.567 | ||
| 1 spectrum, TVIPGMPTVIPPGLTR | 0.000 | 0.000 | 0.000 | 0.000 | 0.000 | 0.000 | 0.326 | 0.674 | ||
| 1 spectrum, CGGAGHIASDCK | 0.000 | 0.000 | 0.000 | 0.169 | 0.000 | 0.000 | 0.412 | 0.419 | ||
| 5 spectra, ILRPWQSSETR | 0.000 | 0.000 | 0.000 | 0.109 | 0.031 | 0.000 | 0.421 | 0.439 | ||
| 2 spectra, FQRPGDPQSAQDK | 0.000 | 0.000 | 0.000 | 0.000 | 0.339 | 0.000 | 0.398 | 0.262 | ||
| 1 spectrum, QGIETPEDQNDLR | 0.000 | 0.000 | 0.000 | 0.122 | 0.000 | 0.000 | 0.434 | 0.444 | ||
| 1 spectrum, SITNTTVCTK | 0.000 | 0.000 | 0.000 | 0.000 | 0.000 | 0.000 | 0.342 | 0.658 |
| Plot | Mito | Lyso or Perox | ER | Golgi | PM | Cytosol | Nucleus | ||||||
| Expt B |
1 peptide |
1 spectrum |
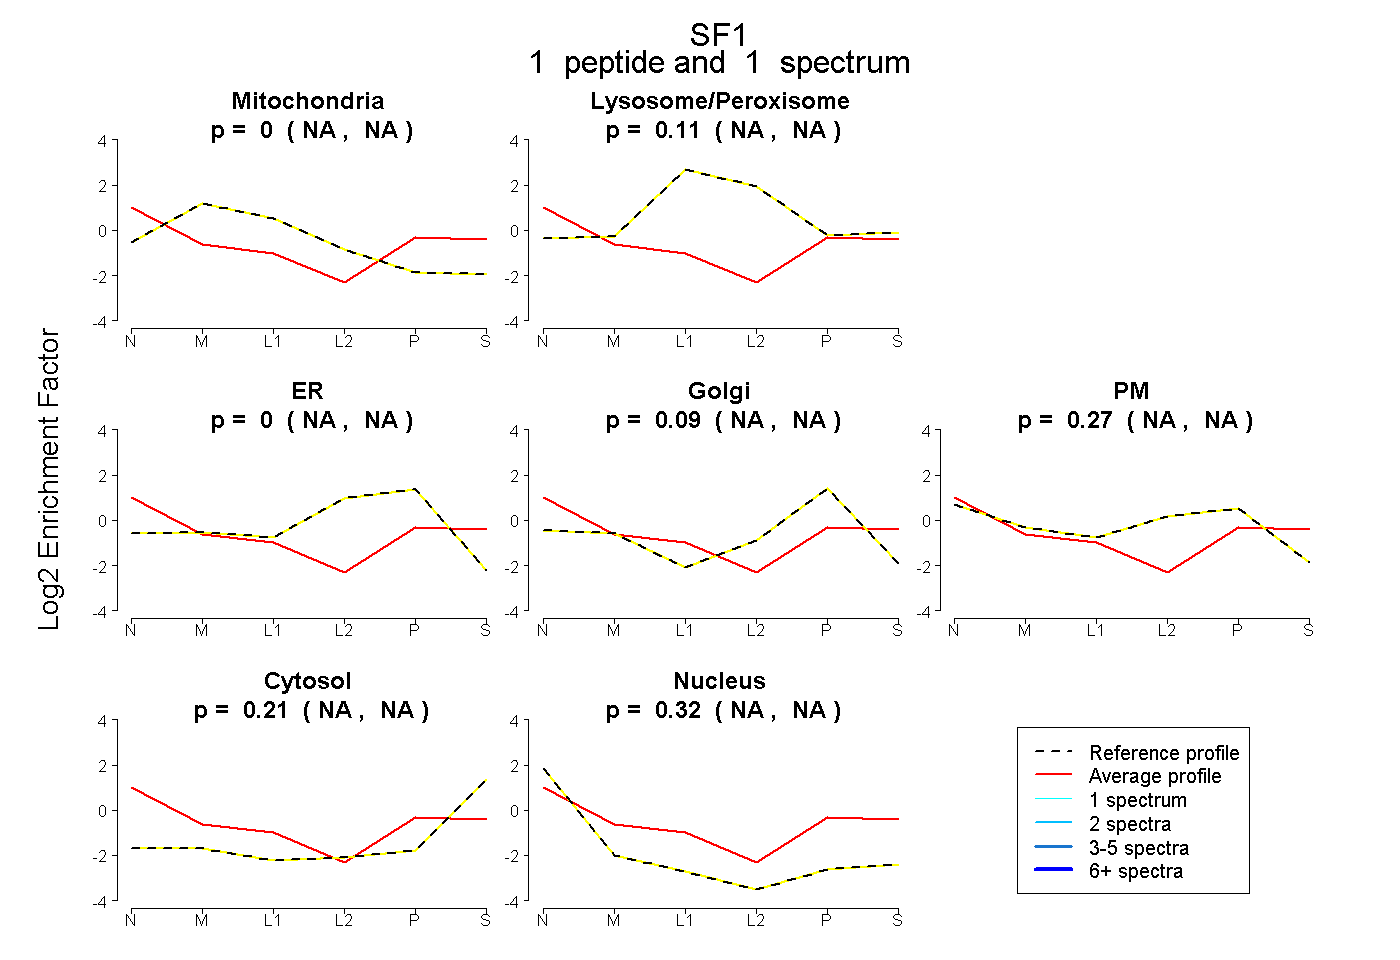 |
0.000 NA | NA |
0.109 NA | NA |
0.000 NA | NA |
0.091 NA | NA |
0.267 NA | NA |
0.211 NA | NA |
0.321 NA | NA |
|||
| Plot | Lyso | Other | |||||||||||
| Expt C |
5 peptides |
17 spectra |
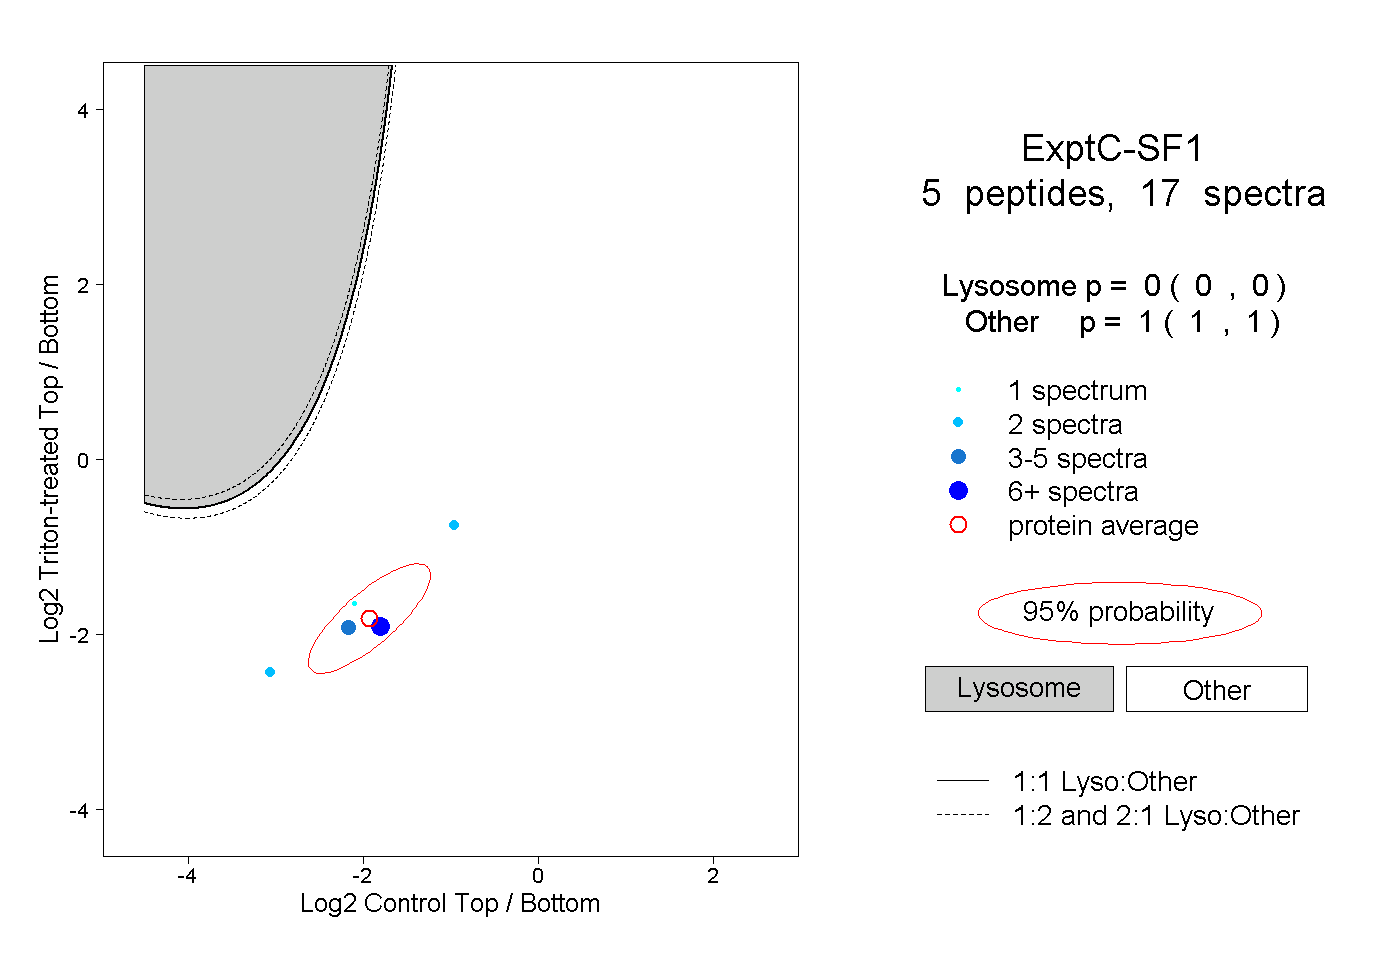 |
0.000 0.000 | 0.000 |
1.000 1.000 | 1.000 |