 13
13peptides
spectra
0.000 | 0.000
0.575 | 0.631
0.000 | 0.000
0.000 | 0.000
0.000 | 0.000
0.365 | 0.419
0.000 | 0.000
0.000 | 0.000
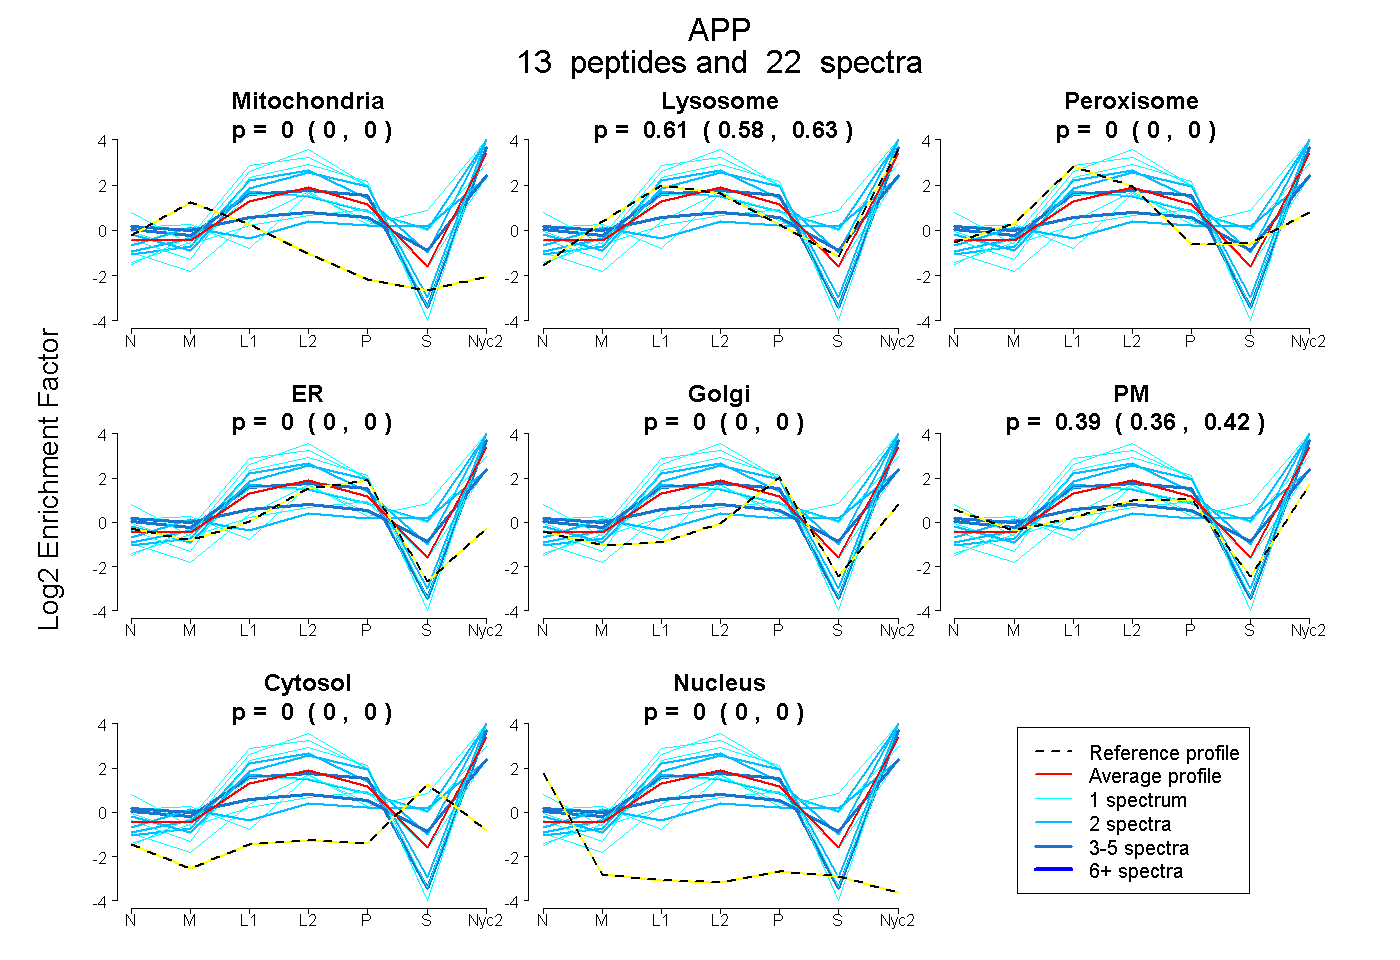
| Plot | Mito | Lyso | Perox | ER | Golgi | PM | Cytosol | Nucleus | |||||
| Expt A |
13 peptides |
22 spectra |
|
0.000 0.000 | 0.000 |
0.606 0.575 | 0.631 |
0.000 0.000 | 0.000 |
0.000 0.000 | 0.000 |
0.000 0.000 | 0.000 |
0.394 0.365 | 0.419 |
0.000 0.000 | 0.000 |
0.000 0.000 | 0.000 |
| 1 spectrum, AVIQHFQEK | 0.000 | 0.740 | 0.000 | 0.000 | 0.000 | 0.000 | 0.260 | 0.000 | ||
| 2 spectra, WYFDVTEGK | 0.000 | 0.562 | 0.000 | 0.000 | 0.000 | 0.438 | 0.000 | 0.000 | ||
| 1 spectrum, MDVCETHLHWHTVAK | 0.000 | 0.597 | 0.083 | 0.000 | 0.000 | 0.212 | 0.108 | 0.000 | ||
| 1 spectrum, LVFFAEDVGSNK | 0.000 | 0.551 | 0.000 | 0.062 | 0.000 | 0.387 | 0.000 | 0.000 | ||
| 3 spectra, GLTTRPGSGLTNIK | 0.000 | 0.431 | 0.000 | 0.000 | 0.000 | 0.569 | 0.000 | 0.000 | ||
| 1 spectrum, EWEEAER | 0.000 | 0.831 | 0.000 | 0.169 | 0.000 | 0.000 | 0.000 | 0.000 | ||
| 2 spectra, FLHQER | 0.000 | 0.933 | 0.000 | 0.000 | 0.000 | 0.000 | 0.067 | 0.000 | ||
| 2 spectra, QQLVETHMAR | 0.000 | 0.479 | 0.000 | 0.000 | 0.000 | 0.197 | 0.324 | 0.000 | ||
| 1 spectrum, EVCSEQAETGPCR | 0.000 | 0.270 | 0.000 | 0.000 | 0.000 | 0.606 | 0.125 | 0.000 | ||
| 1 spectrum, LNMHMNVQNGK | 0.000 | 0.108 | 0.000 | 0.000 | 0.000 | 0.833 | 0.058 | 0.000 | ||
| 2 spectra, CAPFFYGGCGGNR | 0.000 | 0.948 | 0.000 | 0.052 | 0.000 | 0.000 | 0.000 | 0.000 | ||
| 1 spectrum, VESLEQEAANER | 0.000 | 0.829 | 0.000 | 0.171 | 0.000 | 0.000 | 0.000 | 0.000 | ||
| 4 spectra, SQVMTHLR | 0.000 | 0.372 | 0.000 | 0.000 | 0.000 | 0.510 | 0.118 | 0.000 |
| Plot | Mito | Lyso or Perox | ER | Golgi | PM | Cytosol | Nucleus | ||||||
| Expt B |
1 peptide |
2 spectra |
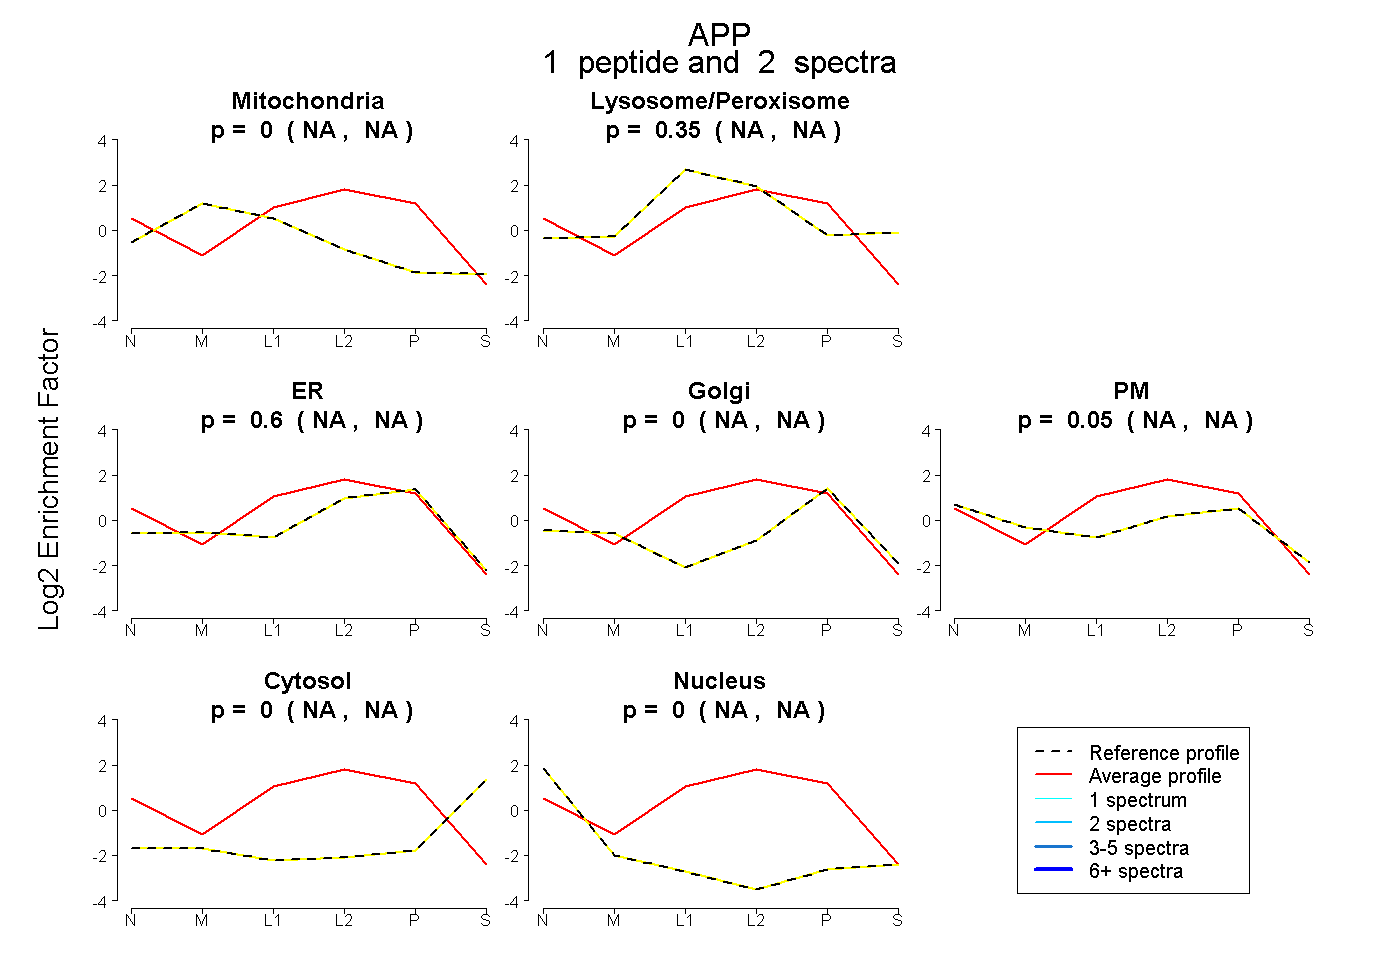 |
0.000 NA | NA |
0.348 NA | NA |
0.602 NA | NA |
0.000 NA | NA |
0.051 NA | NA |
0.000 NA | NA |
0.000 NA | NA |
|||
| Plot | Lyso | Other | |||||||||||
| Expt C |
14 peptides |
52 spectra |
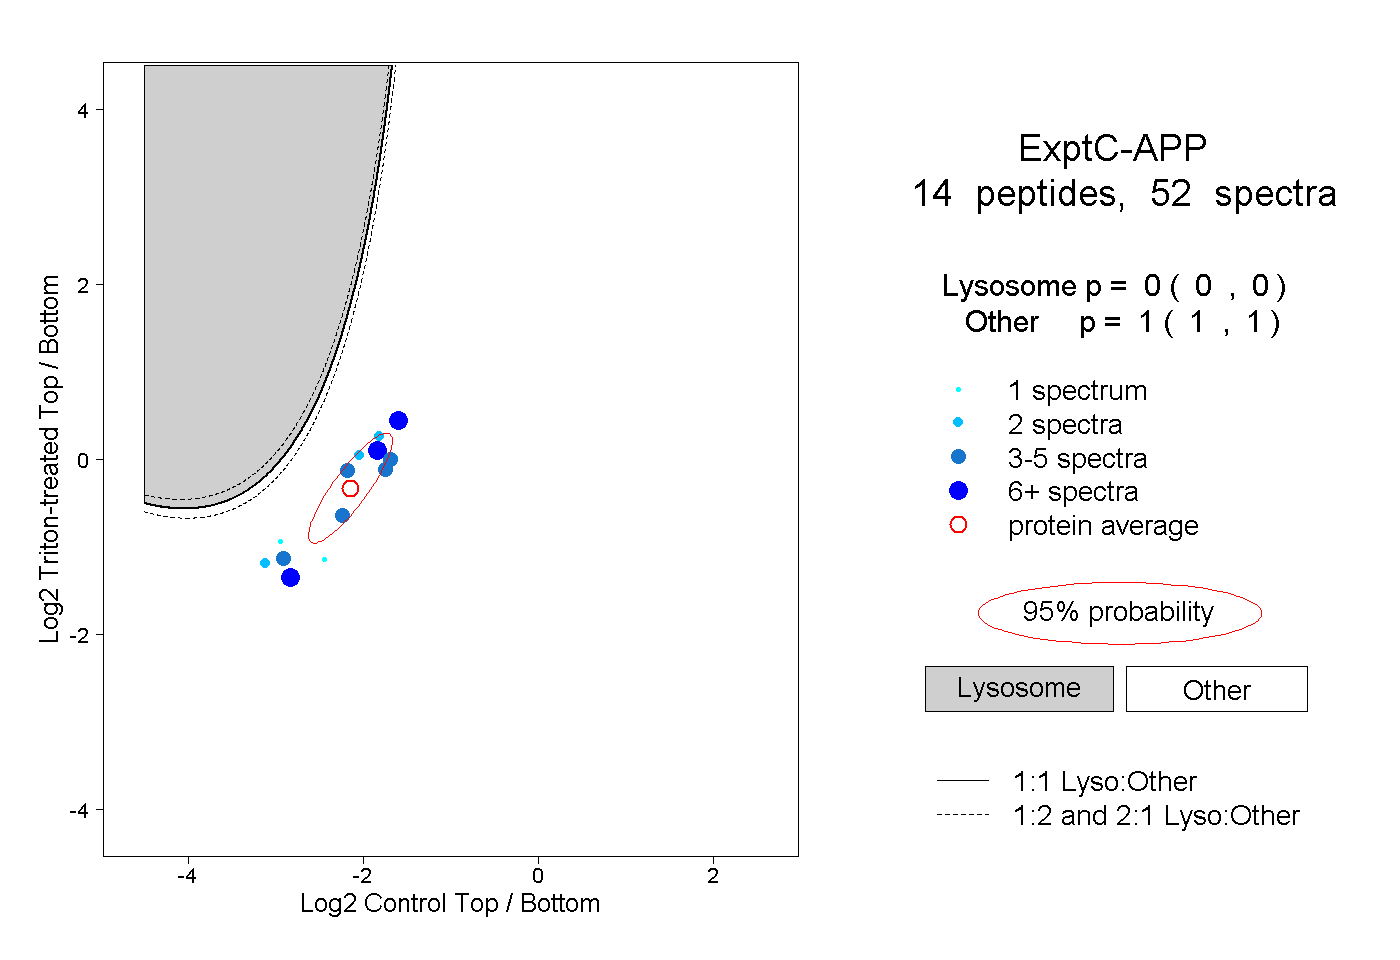 |
0.000 0.000 | 0.000 |
1.000 1.000 | 1.000 |
||||||||
| Plot | Lyso | Other | |||||||||||
| Expt D |
4 peptides |
8 spectra |
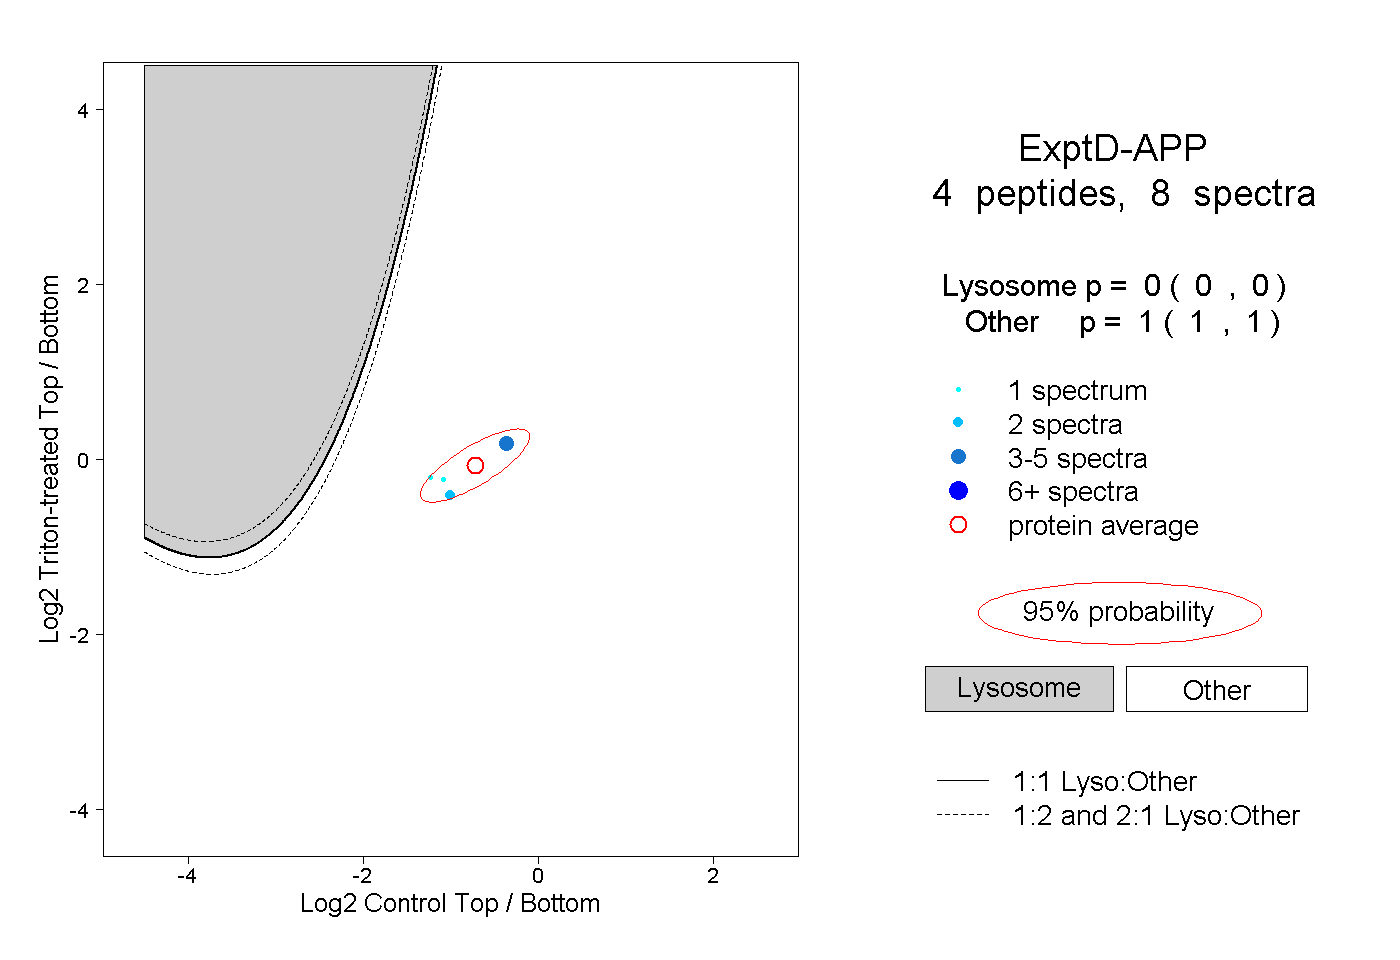 |
0.000 0.000 | 0.000 |
1.000 1.000 | 1.000 |