10
10peptides
spectra
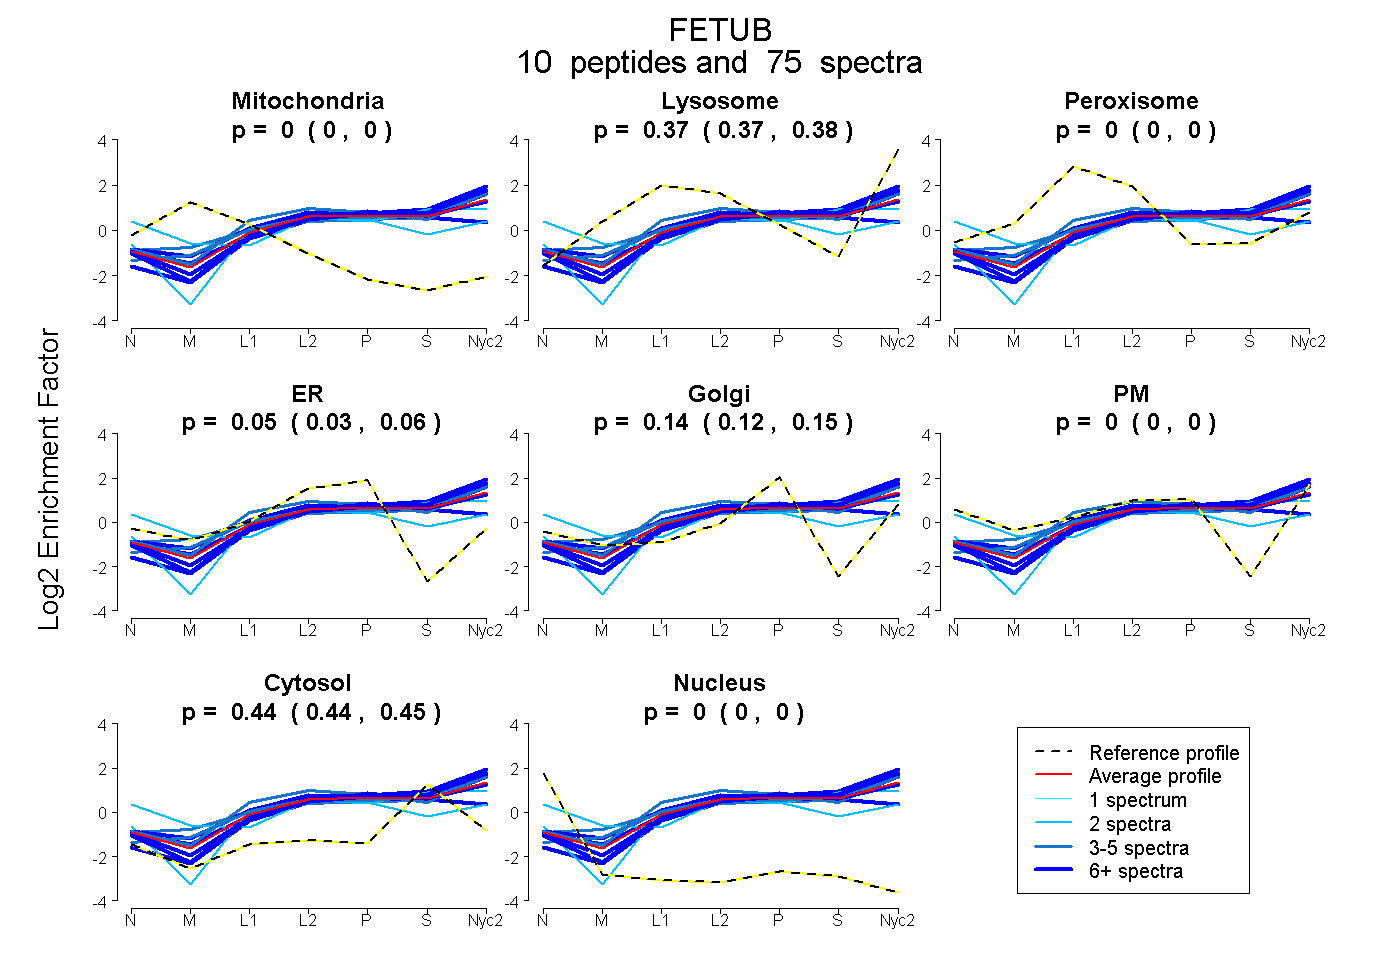
0.000 | 0.000
0.366 | 0.378
0.000 | 0.000
0.032 | 0.059
0.125 | 0.148
0.000 | 0.000
0.438 | 0.446
0.000 | 0.000
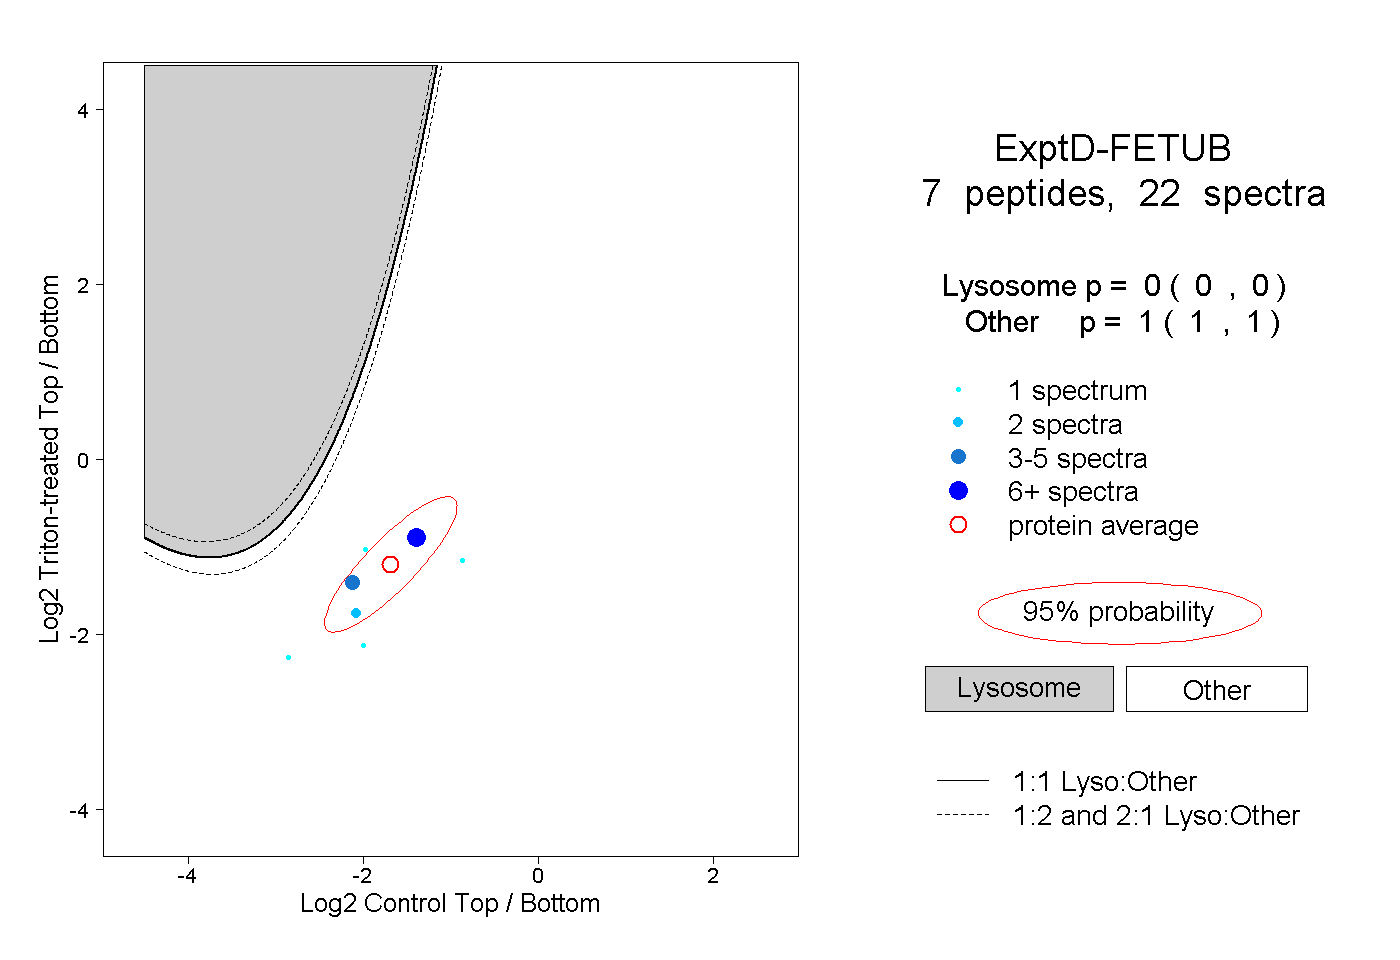
7peptides
spectra
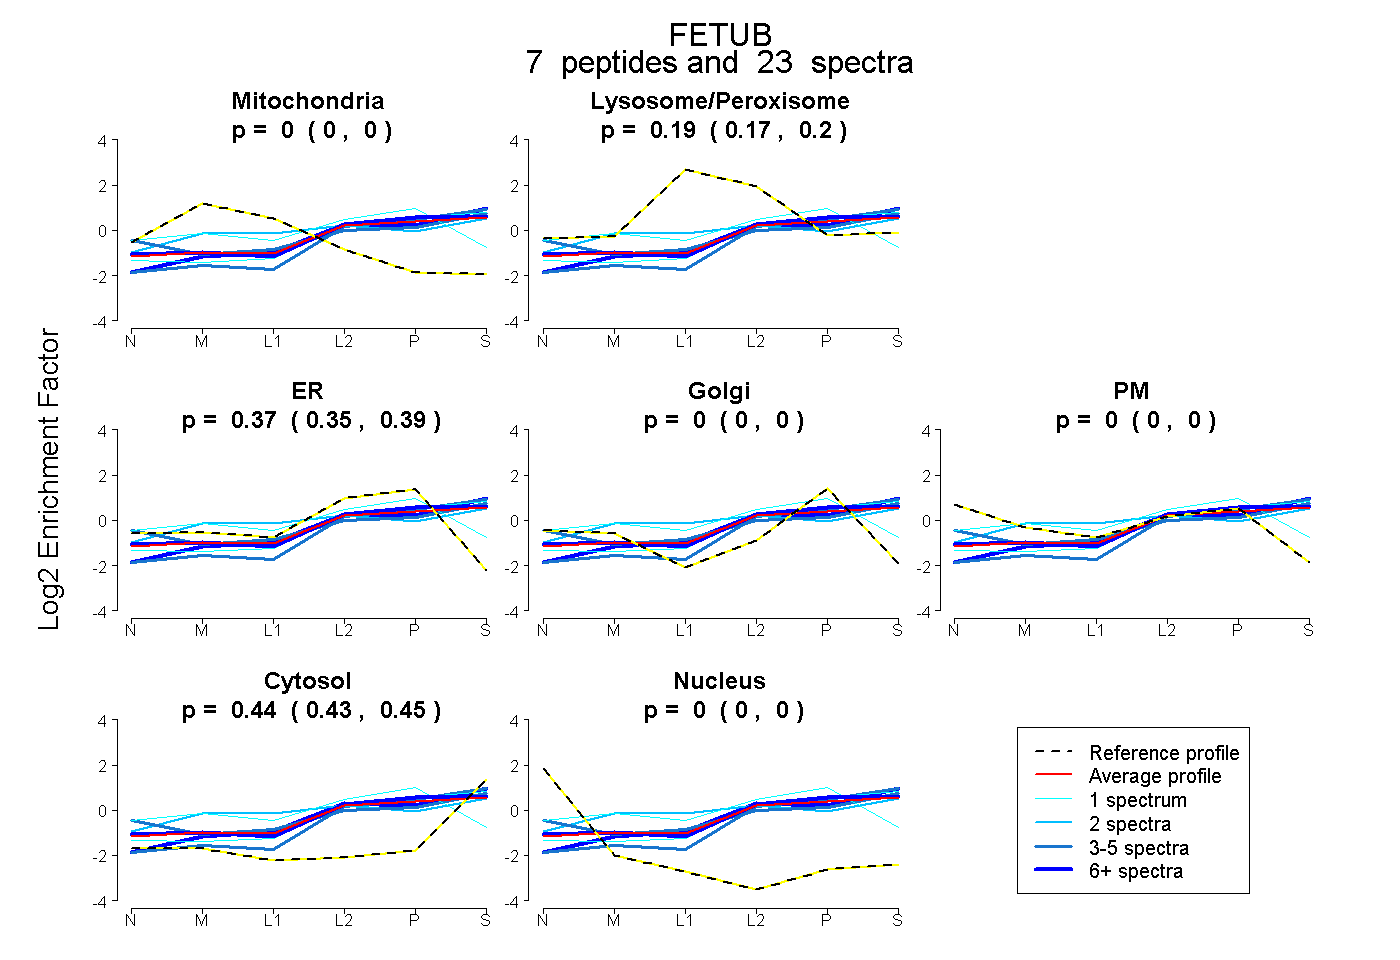
0.000 | 0.000
0.173 | 0.203
0.353 | 0.389
0.000 | 0.000
0.000 | 0.000
0.427 | 0.448
0.000 | 0.000
10peptides
spectra
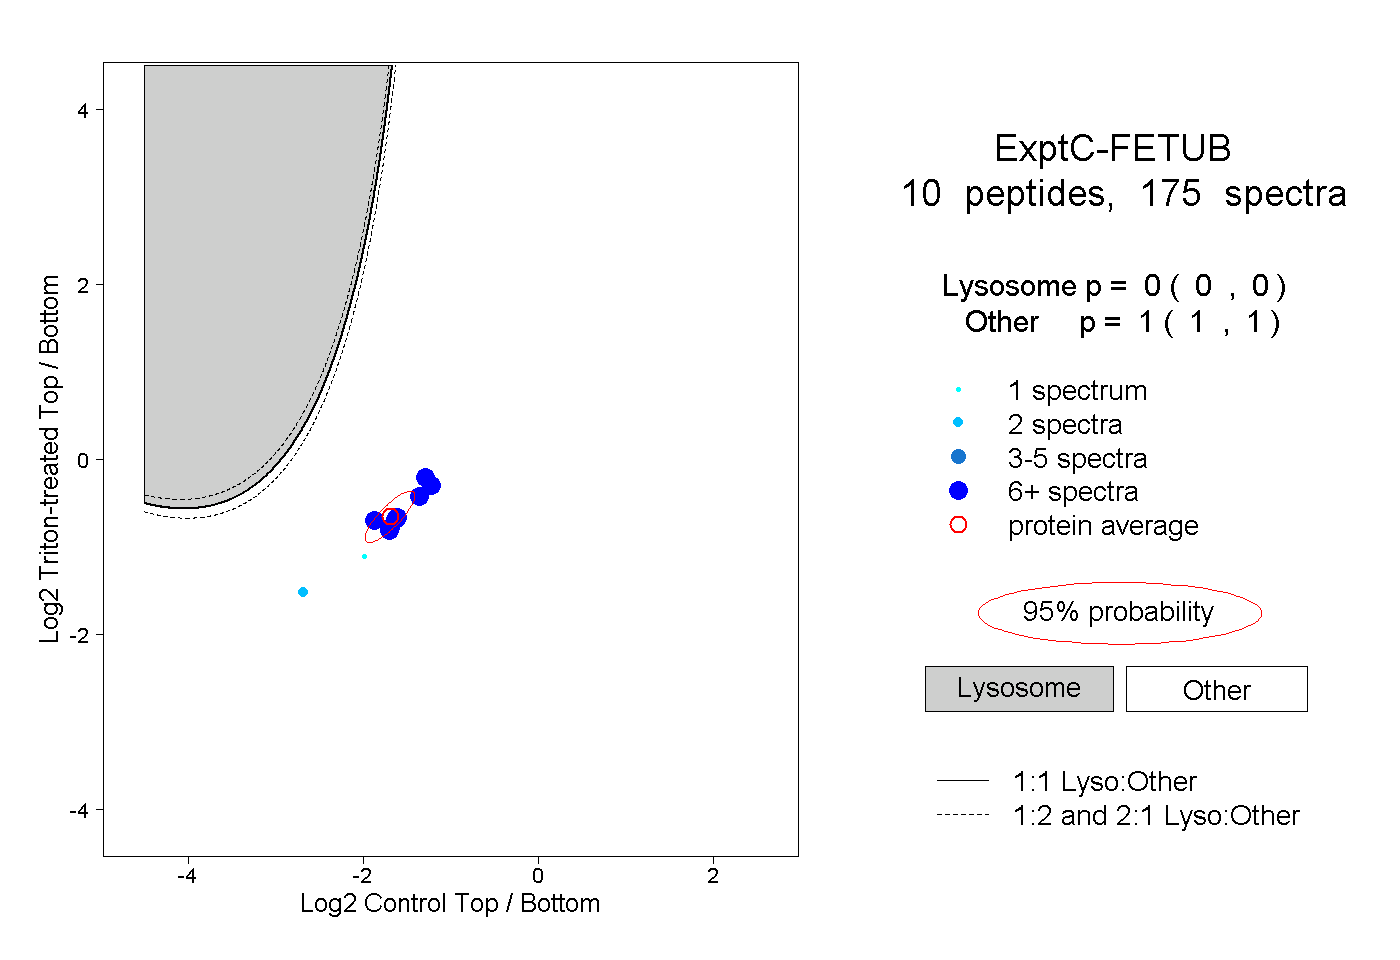
0.000 | 0.000
1.000 | 1.000