17
17peptides
spectra

0.000 | 0.000
0.000 | 0.000
0.000 | 0.000
0.230 | 0.251
0.057 | 0.077
0.624 | 0.641
0.020 | 0.044
0.018 | 0.030
4peptides
spectra
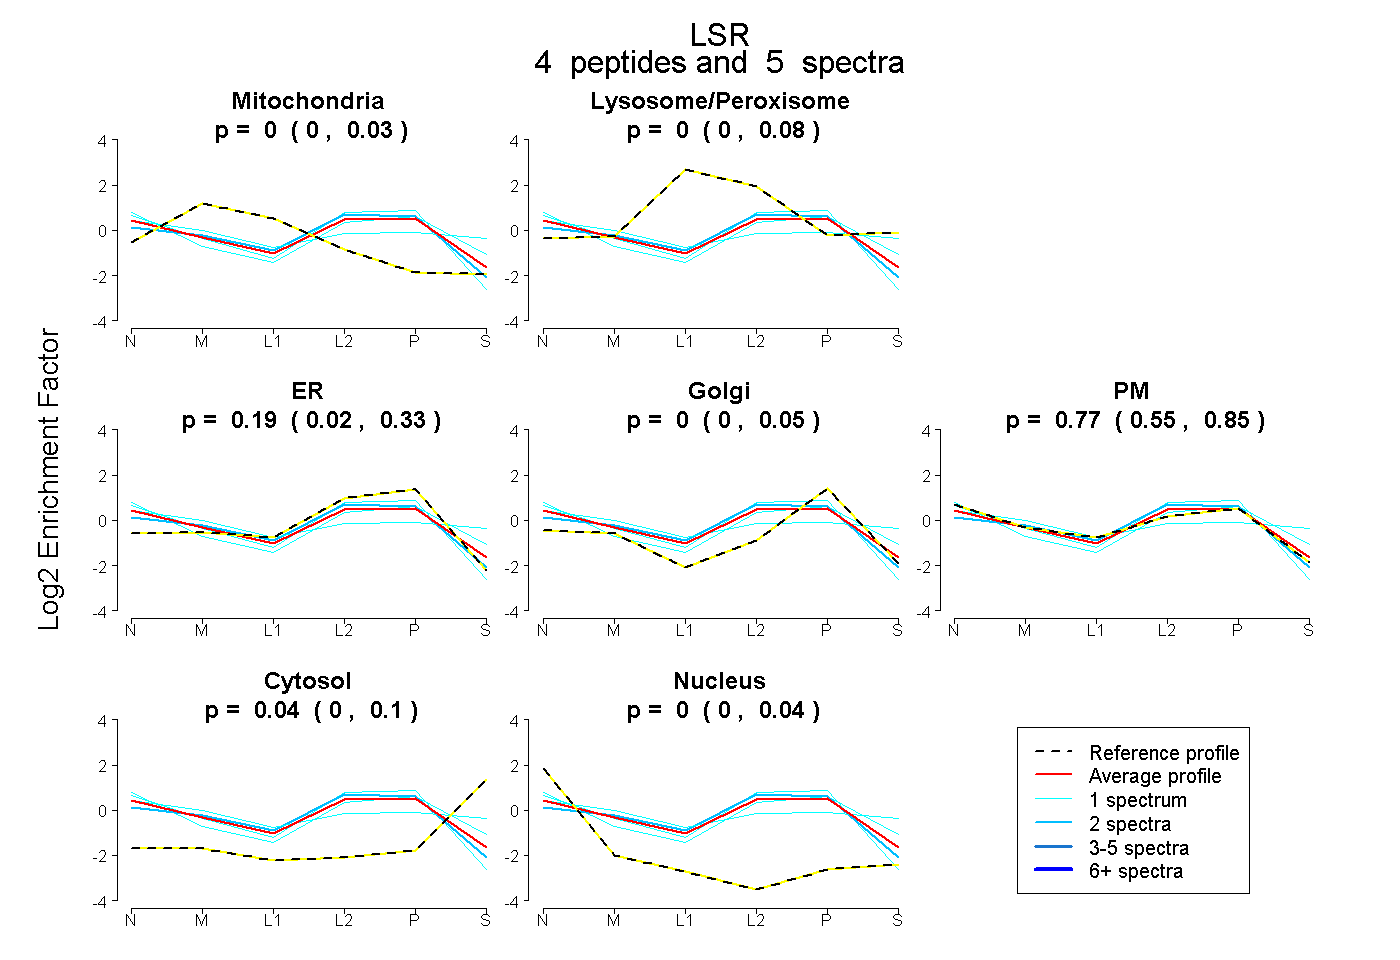
0.000 | 0.032
0.000 | 0.078
0.017 | 0.332
0.000 | 0.052
0.549 | 0.851
0.000 | 0.100
0.000 | 0.040
10peptides
spectra
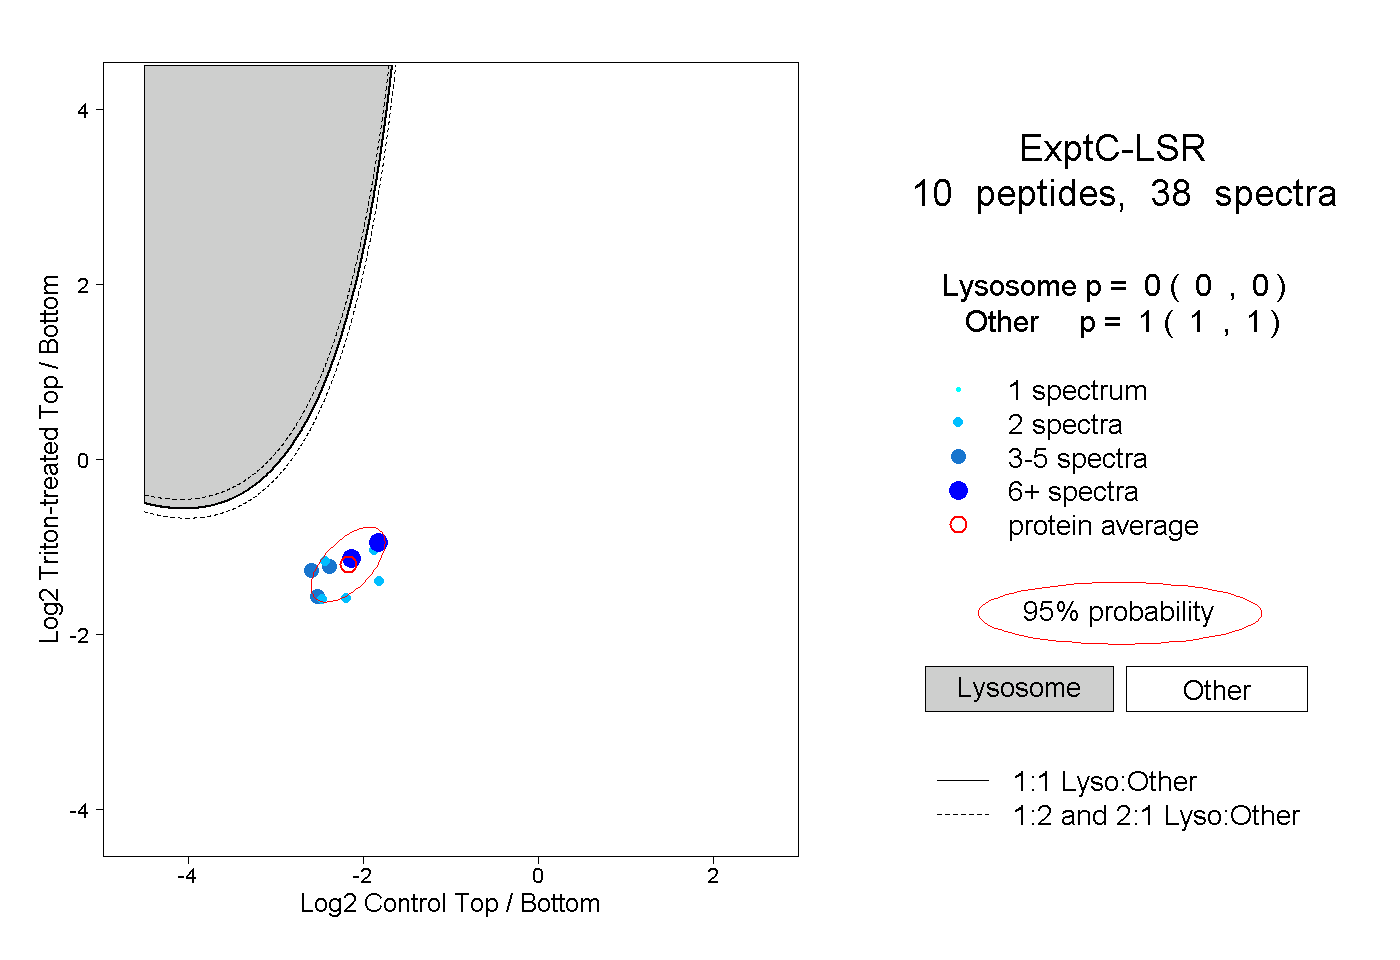
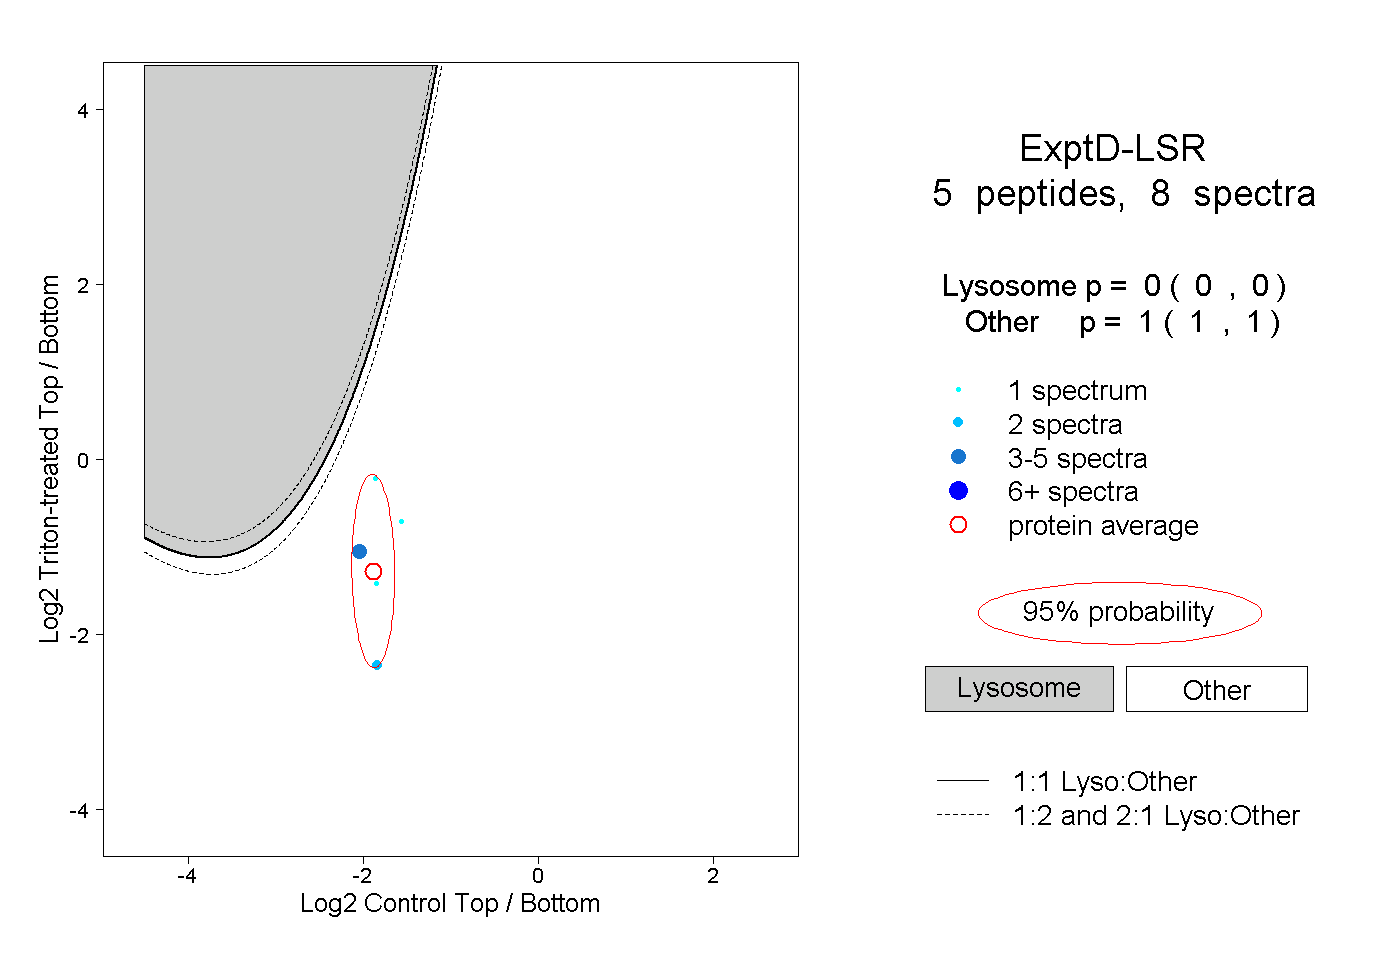
0.000 | 0.000
1.000 | 1.000