 14
14peptides
spectra
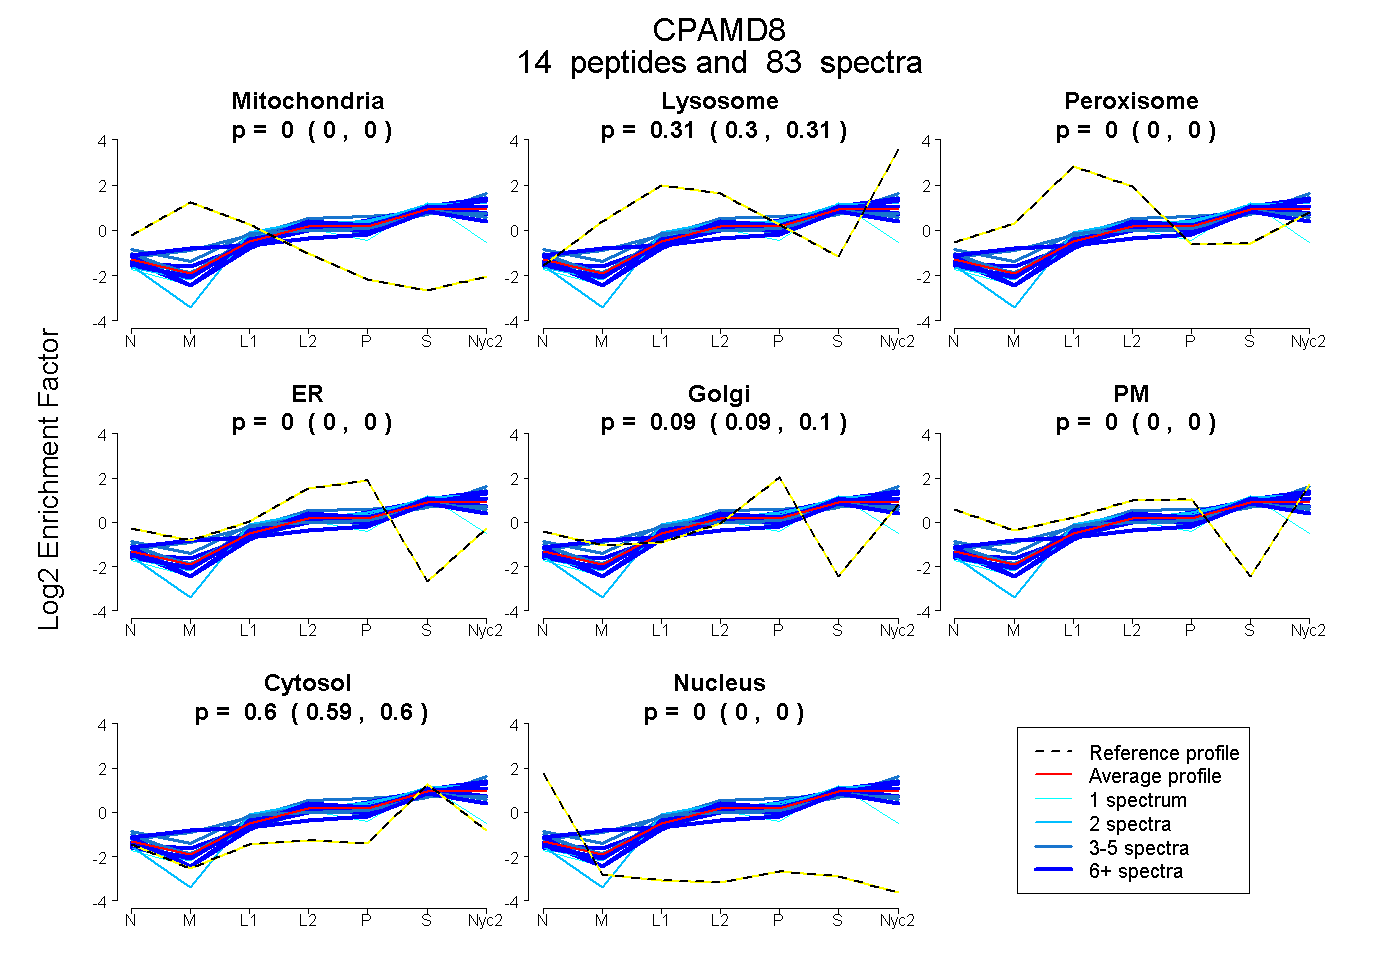
0.000 | 0.000
0.304 | 0.312
0.000 | 0.000
0.000 | 0.000
0.091 | 0.097
0.000 | 0.000
0.594 | 0.600
0.000 | 0.000
33peptides
spectra
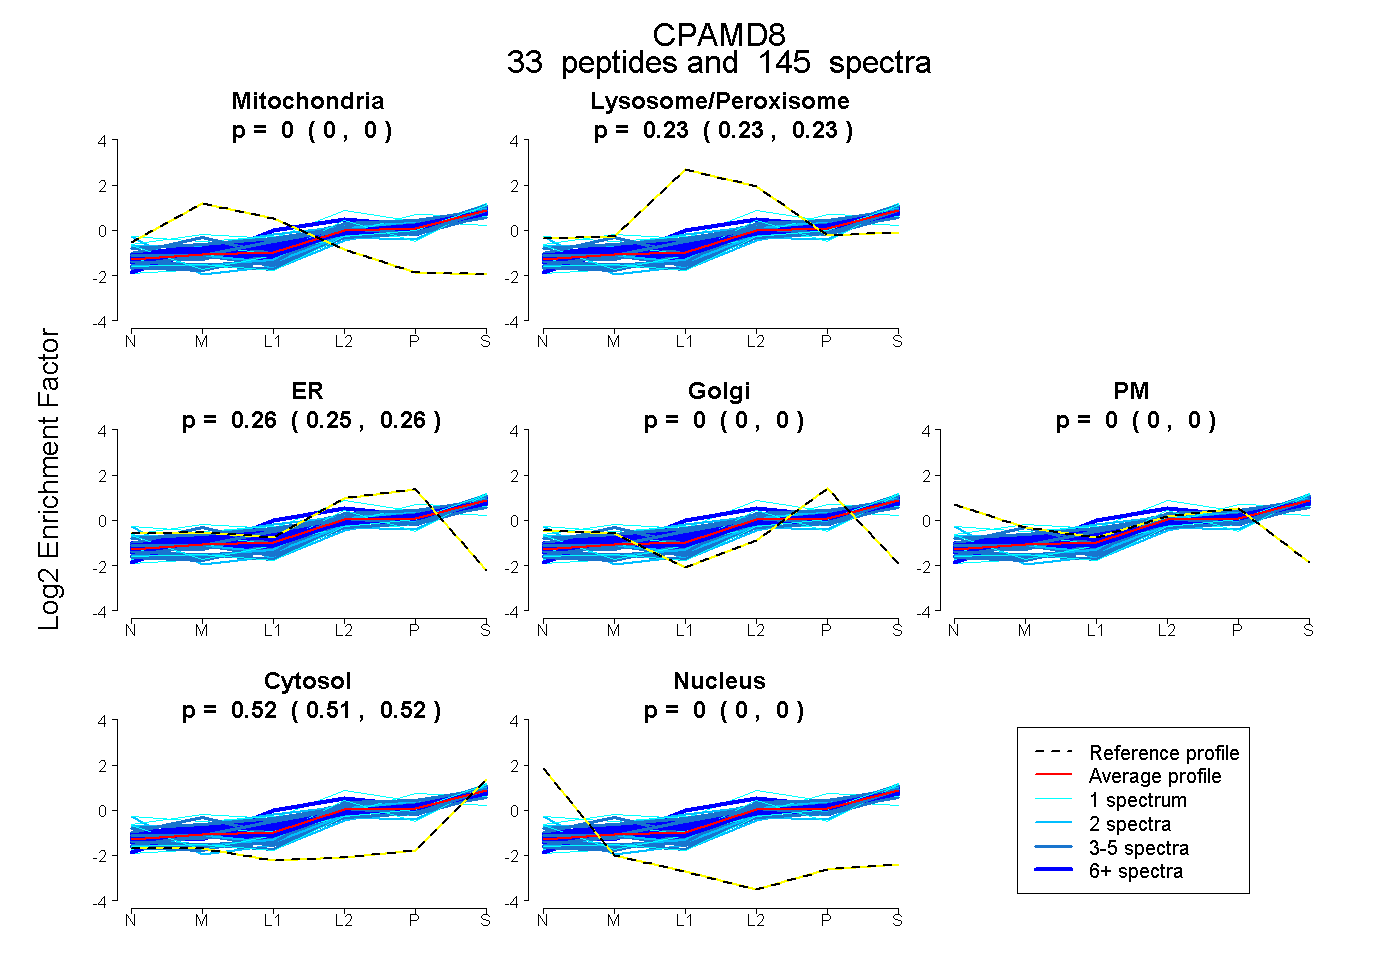
0.000 | 0.000
0.225 | 0.230
0.254 | 0.258
0.000 | 0.000
0.000 | 0.000
0.515 | 0.517
0.000 | 0.000
37peptides
spectra
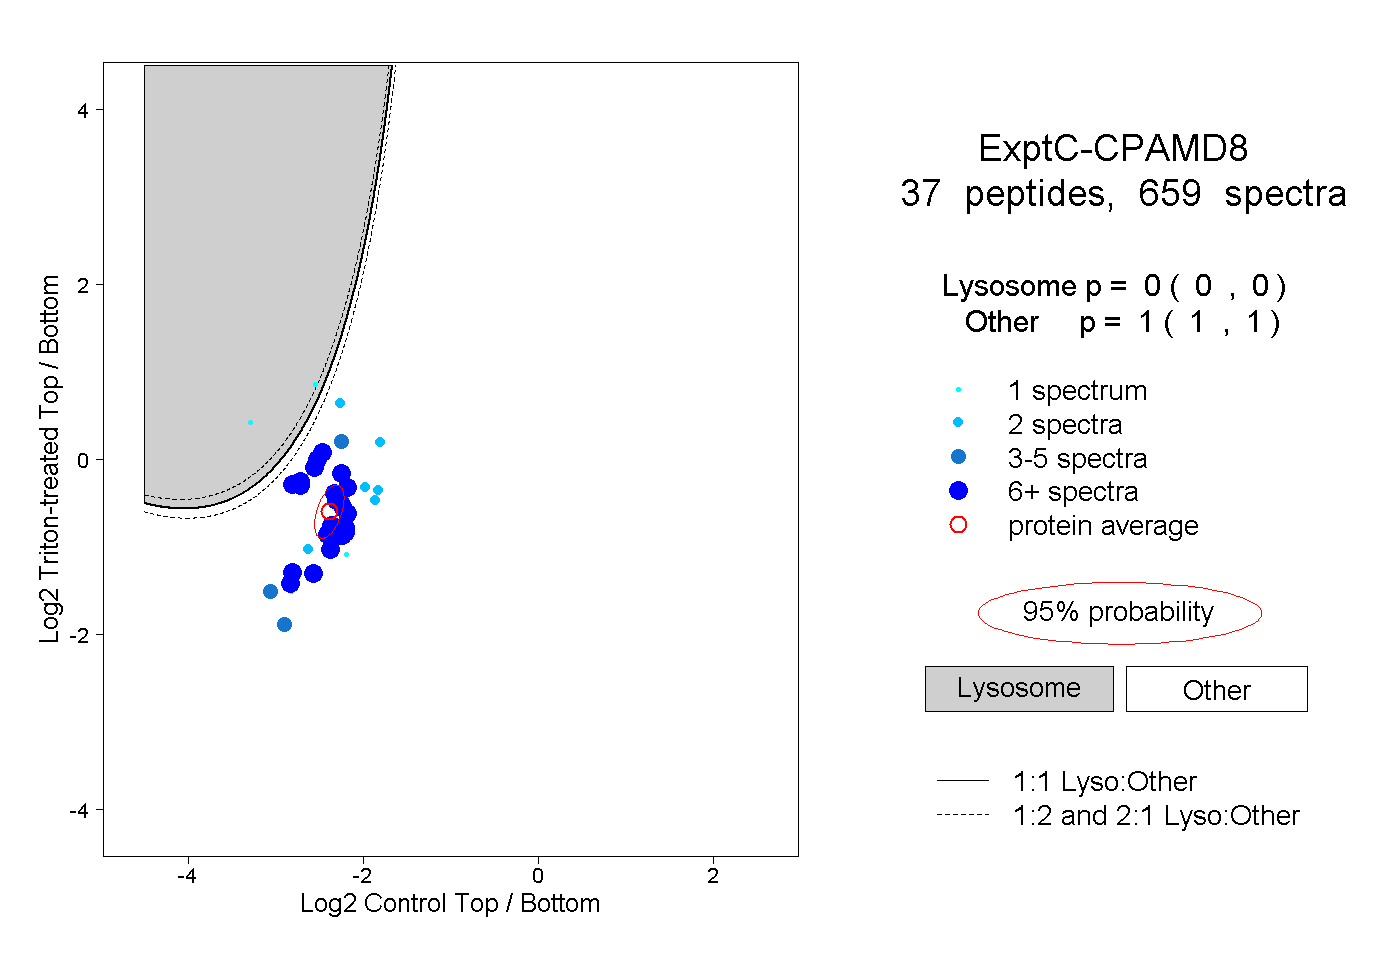
0.000 | 0.000
1.000 | 1.000
6peptides
spectra
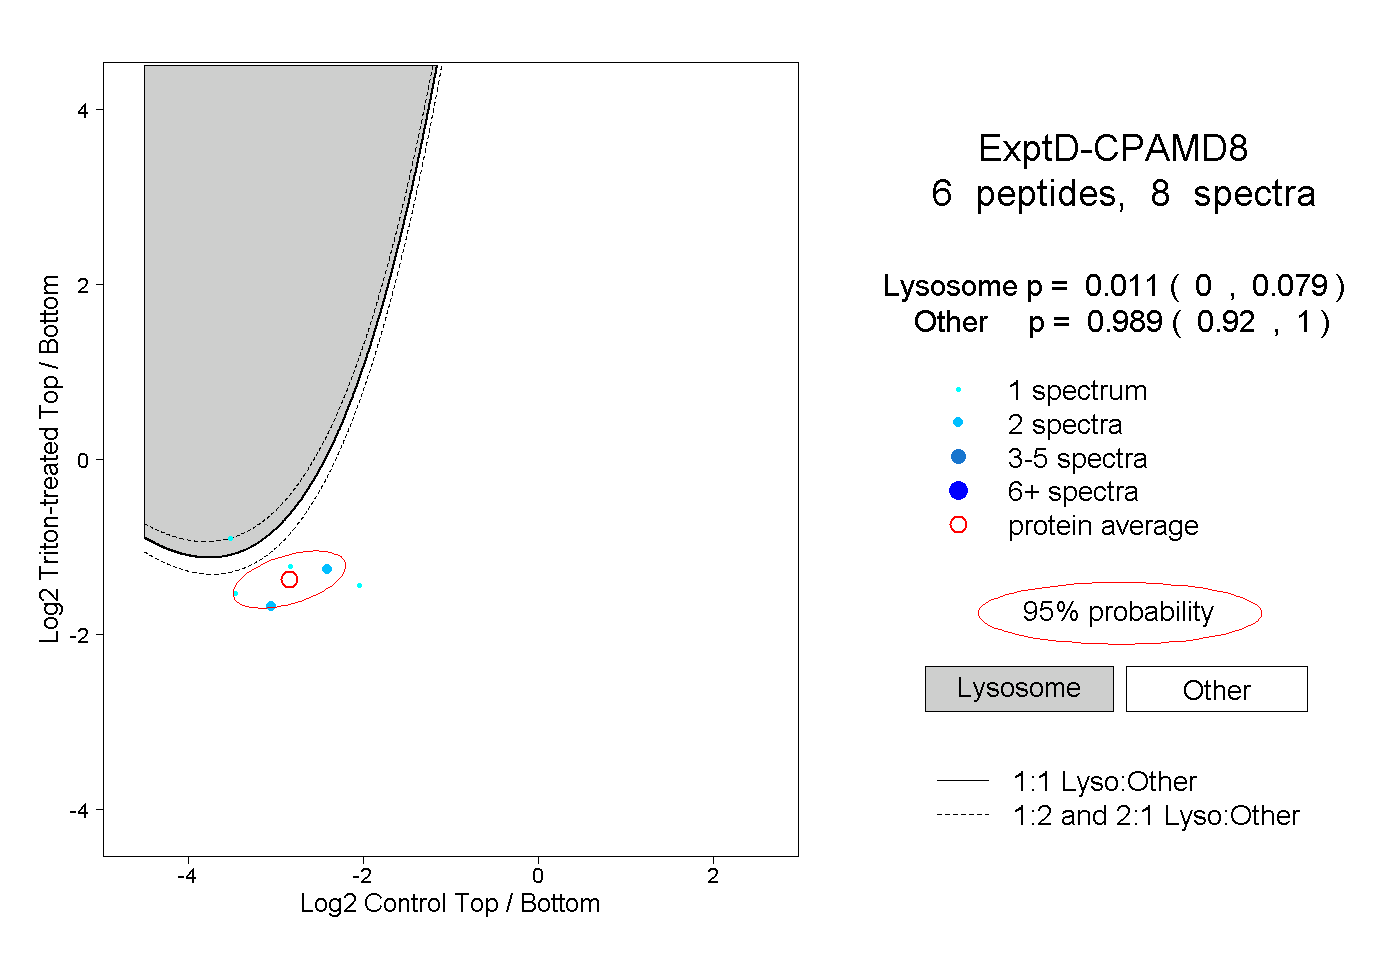
0.000 | 0.079
0.920 | 1.000