 1
1peptide
spectrum
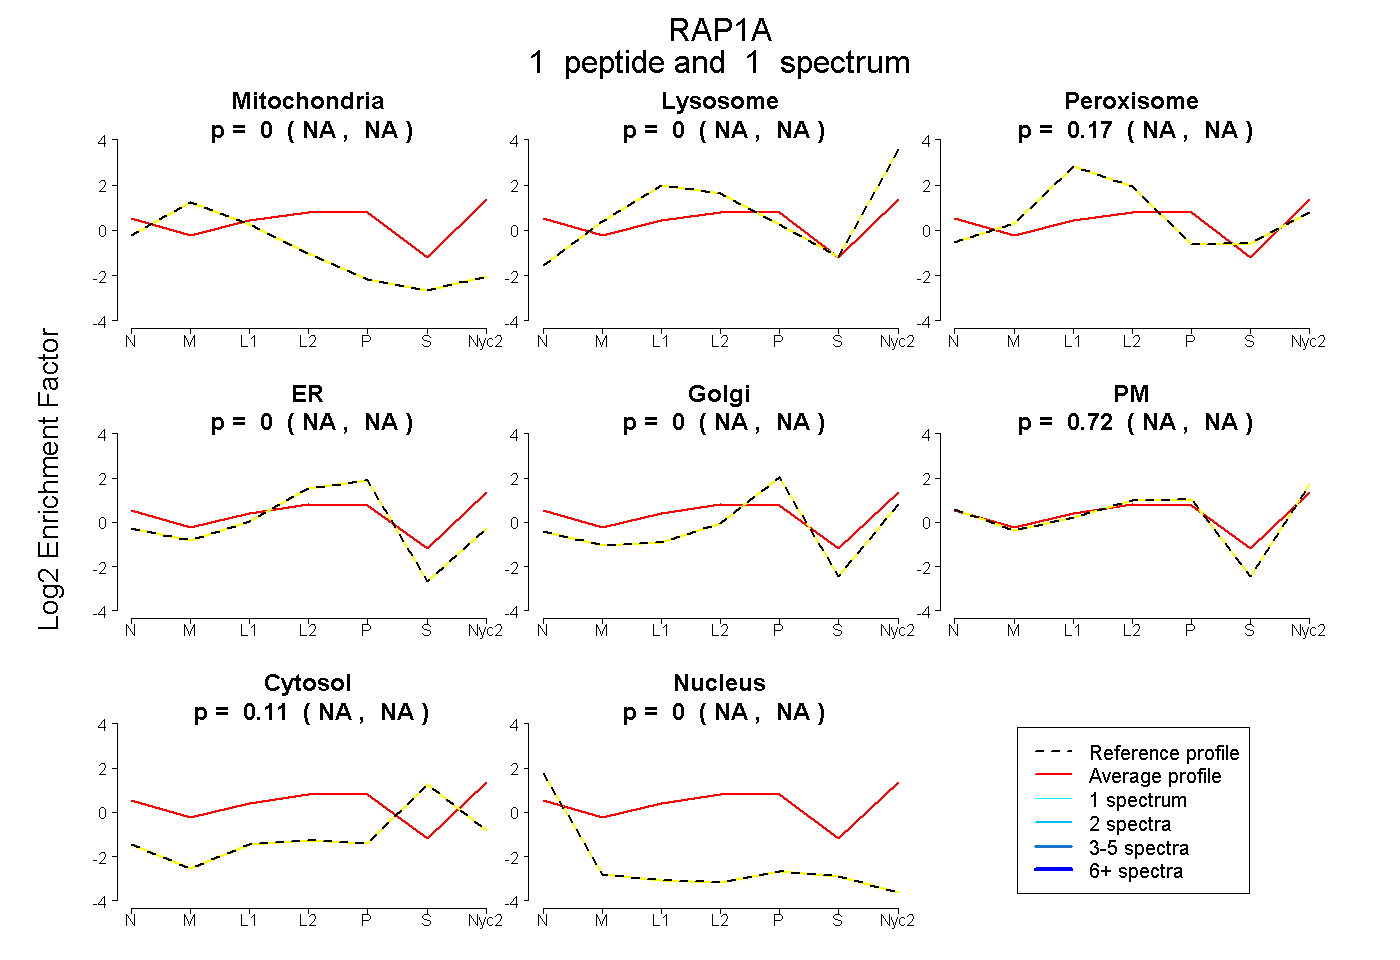
NA | NA
NA | NA
NA | NA
NA | NA
NA | NA
NA | NA
NA | NA
NA | NA
5peptides
spectra
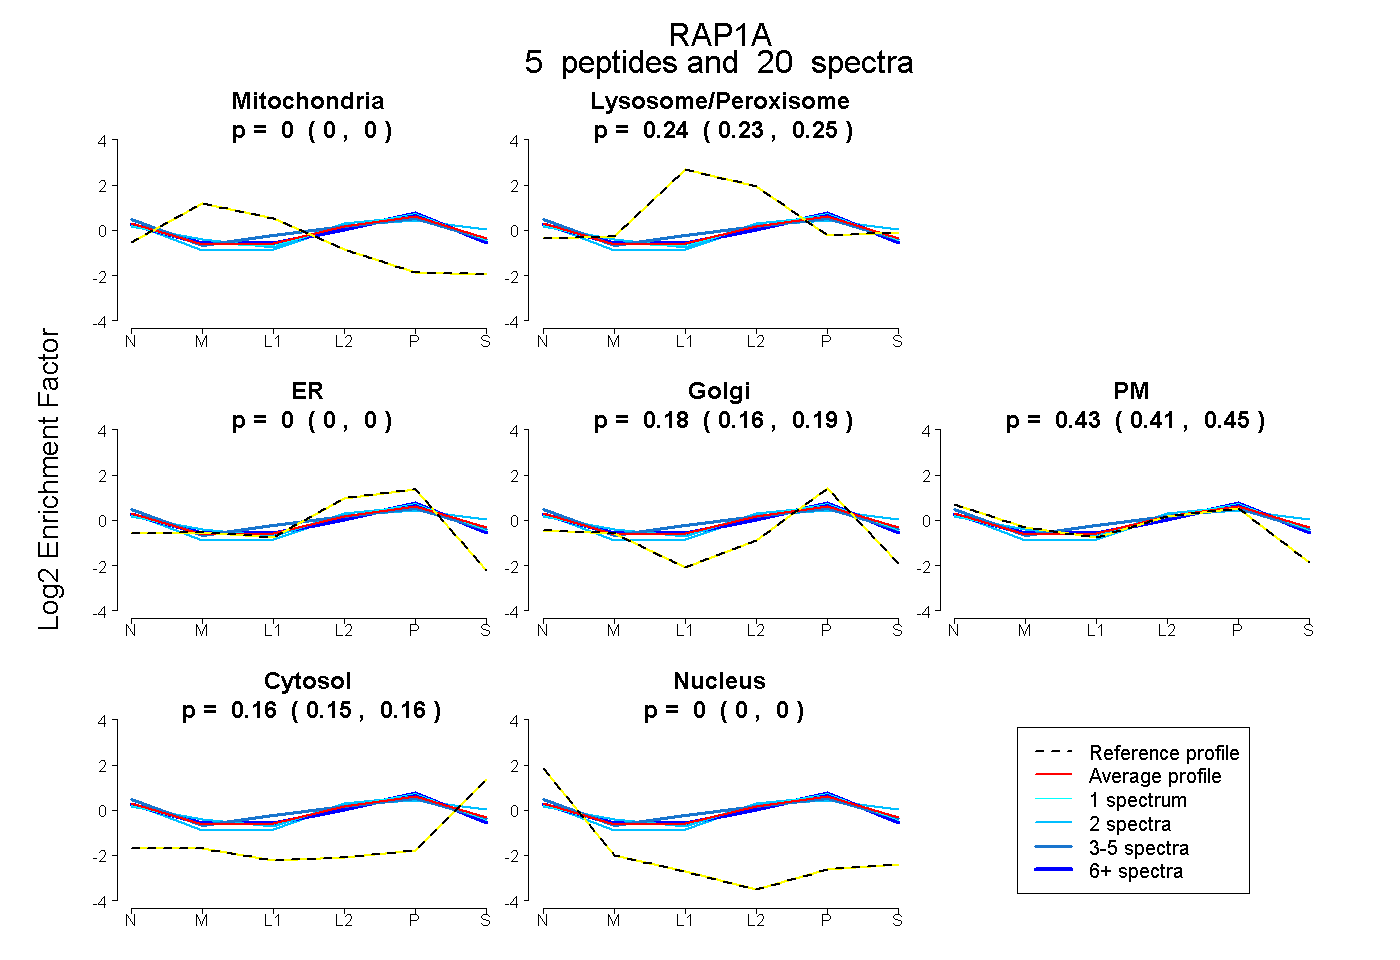
0.000 | 0.000
0.226 | 0.246
0.000 | 0.000
0.158 | 0.192
0.408 | 0.449
0.149 | 0.162
0.000 | 0.000
1peptide
spectrum
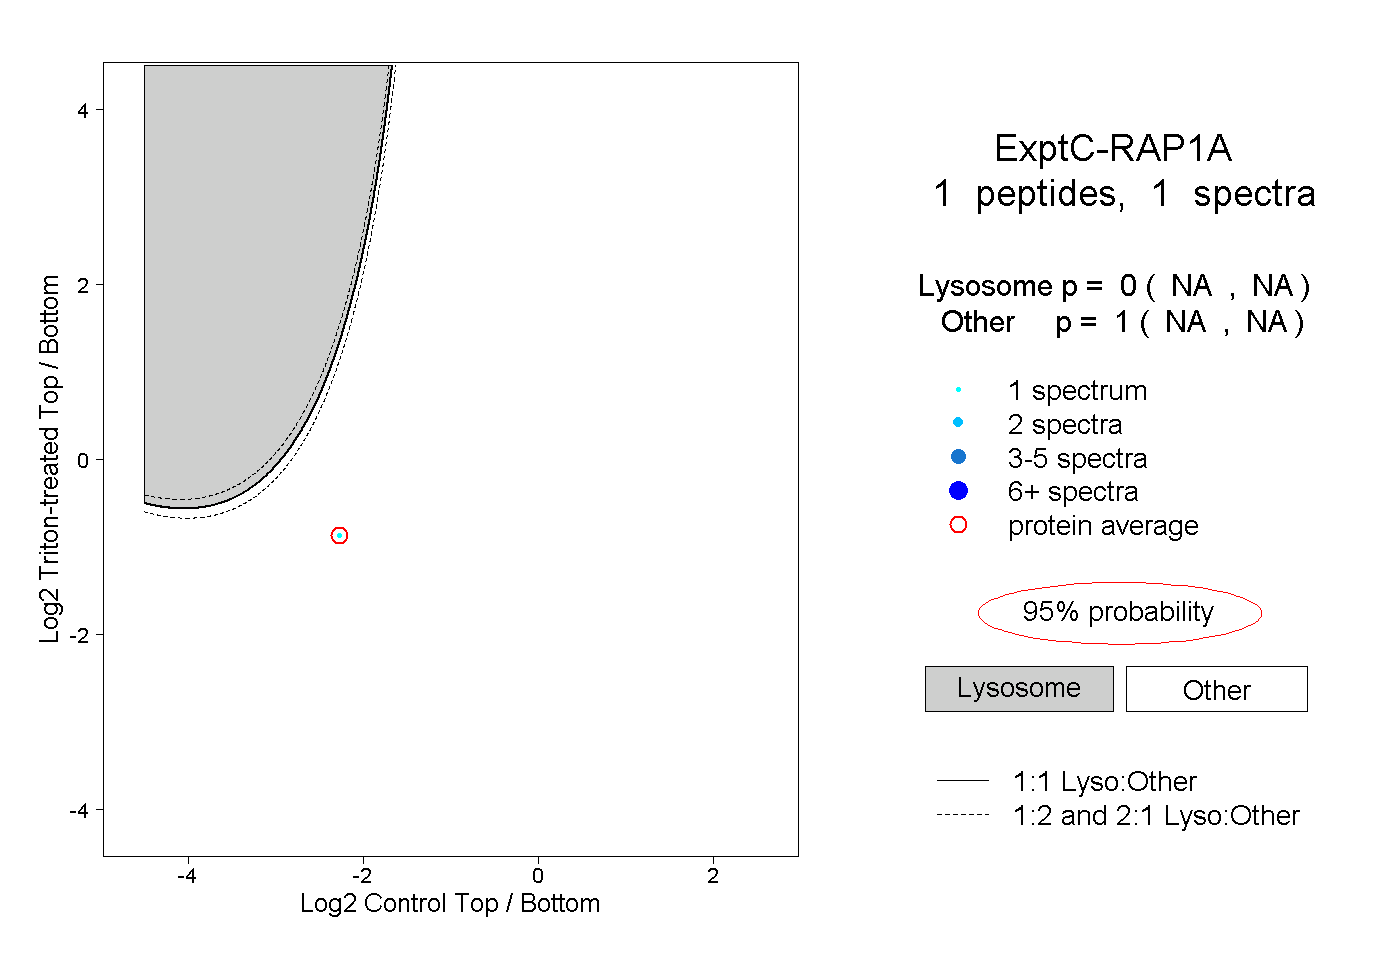
NA | NA
NA | NA