 4
4peptides
spectra
0.000 | 0.000
0.189 | 0.327
0.000 | 0.066
0.043 | 0.292
0.150 | 0.433
0.000 | 0.170
0.083 | 0.242
0.000 | 0.000
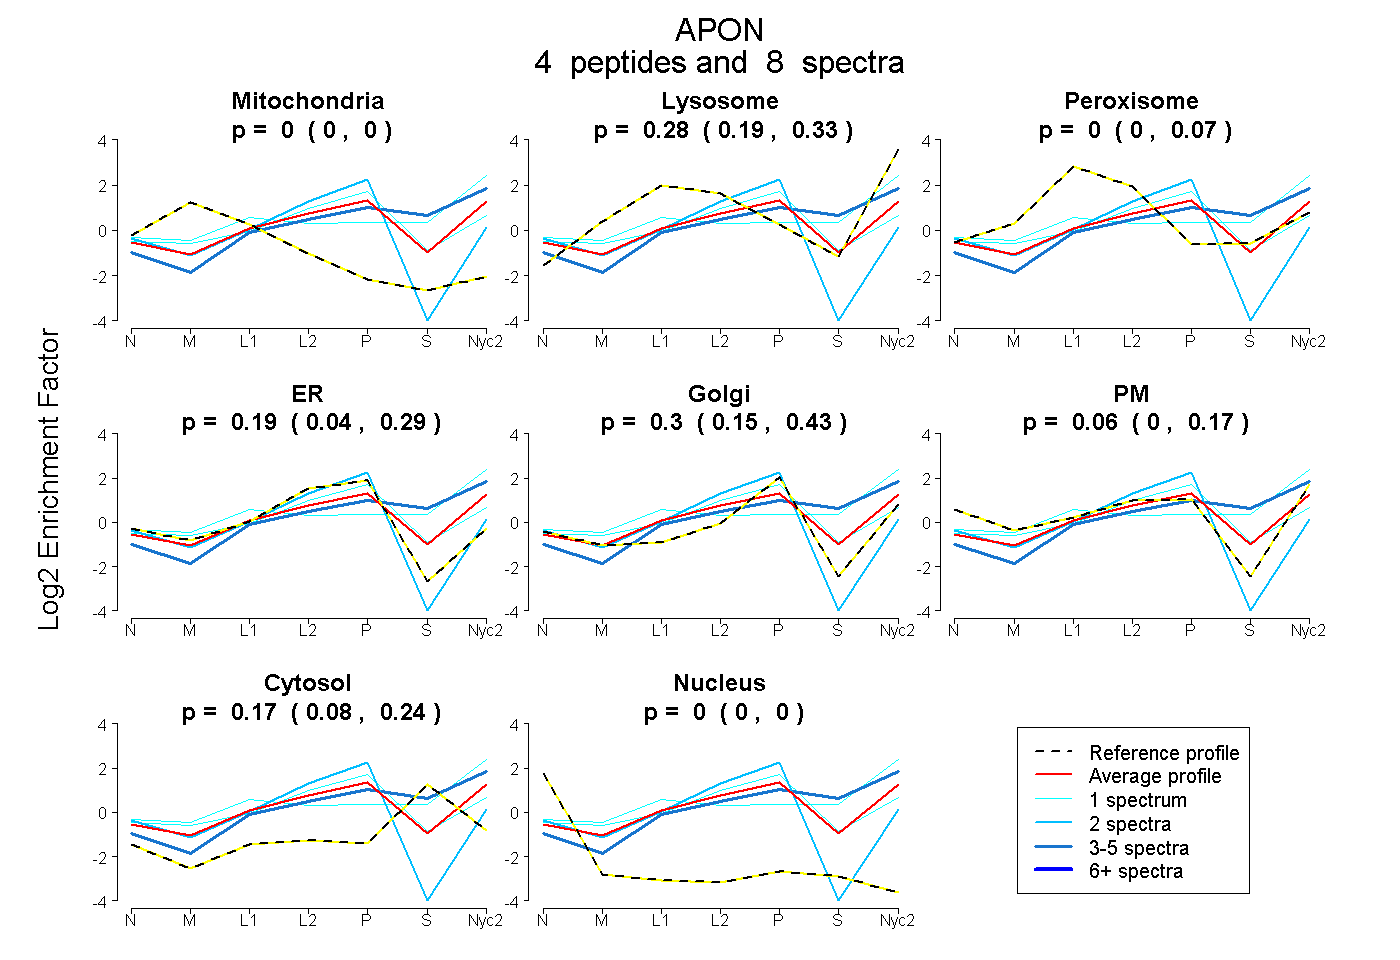
| Plot | Mito | Lyso | Perox | ER | Golgi | PM | Cytosol | Nucleus | |||||
| Expt A |
4 peptides |
8 spectra |
|
0.000 0.000 | 0.000 |
0.277 0.189 | 0.327 |
0.000 0.000 | 0.066 |
0.192 0.043 | 0.292 |
0.302 0.150 | 0.433 |
0.058 0.000 | 0.170 |
0.170 0.083 | 0.242 |
0.000 0.000 | 0.000 |
| 1 spectrum, DSTETLILESQK | 0.000 | 0.170 | 0.053 | 0.377 | 0.262 | 0.000 | 0.137 | 0.000 | ||
| 4 spectra, LPSIDLVR | 0.000 | 0.396 | 0.000 | 0.000 | 0.205 | 0.000 | 0.399 | 0.000 | ||
| 2 spectra, SPPPTSSTCR | 0.000 | 0.000 | 0.000 | 0.852 | 0.148 | 0.000 | 0.000 | 0.000 | ||
| 1 spectrum, ELAQLLVEVAEK | 0.000 | 0.525 | 0.000 | 0.000 | 0.000 | 0.168 | 0.307 | 0.000 |
| Plot | Mito | Lyso or Perox | ER | Golgi | PM | Cytosol | Nucleus | ||||||
| Expt B |
1 peptide |
1 spectrum |
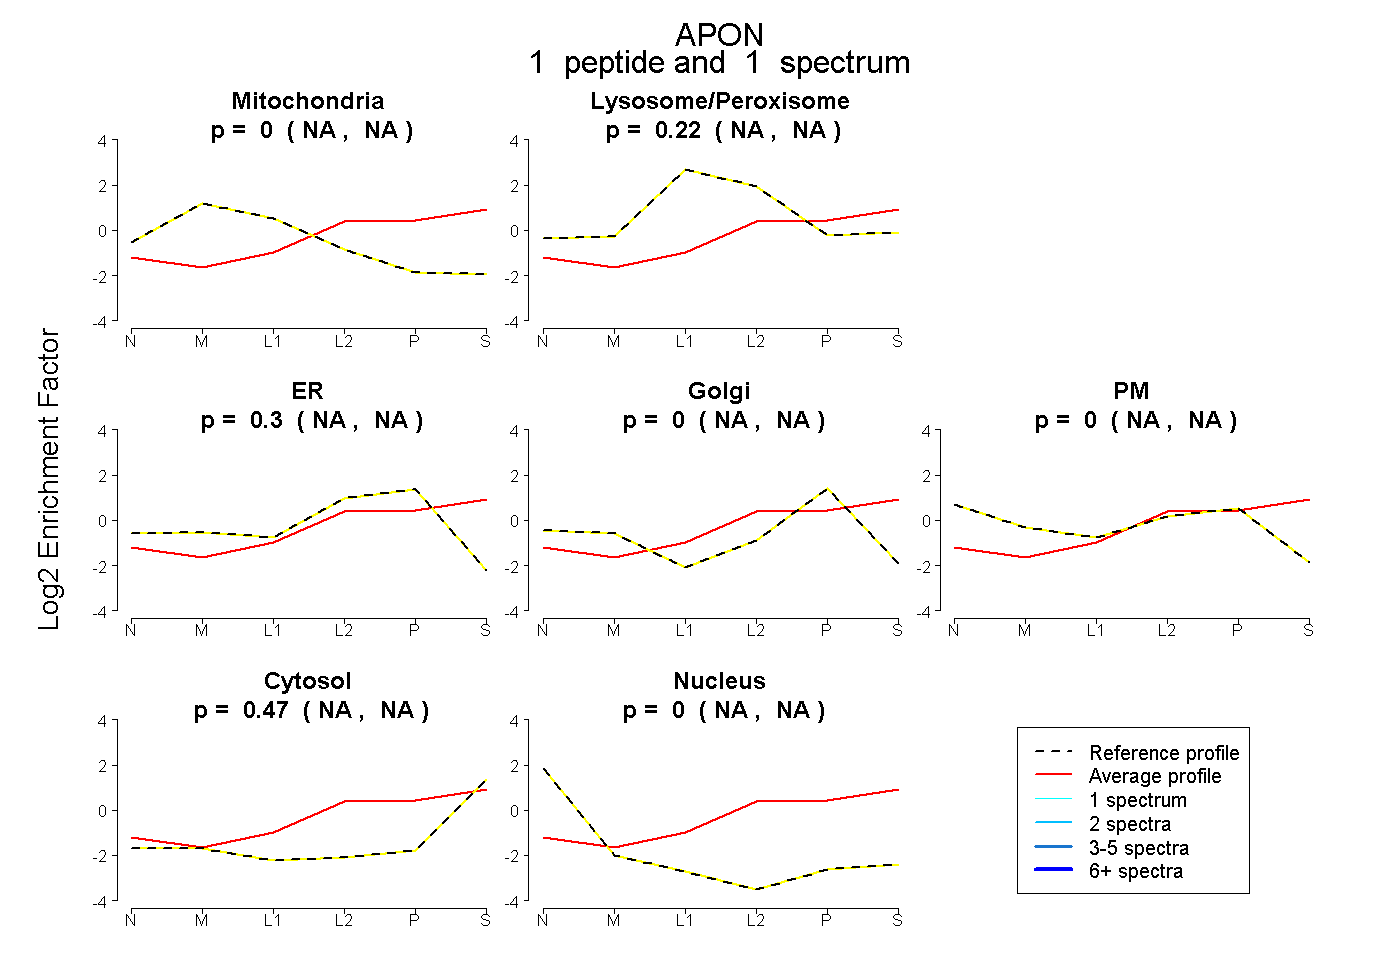 |
0.000 NA | NA |
0.223 NA | NA |
0.304 NA | NA |
0.000 NA | NA |
0.000 NA | NA |
0.473 NA | NA |
0.000 NA | NA |
|||
| Plot | Lyso | Other | |||||||||||
| Expt C |
4 peptides |
10 spectra |
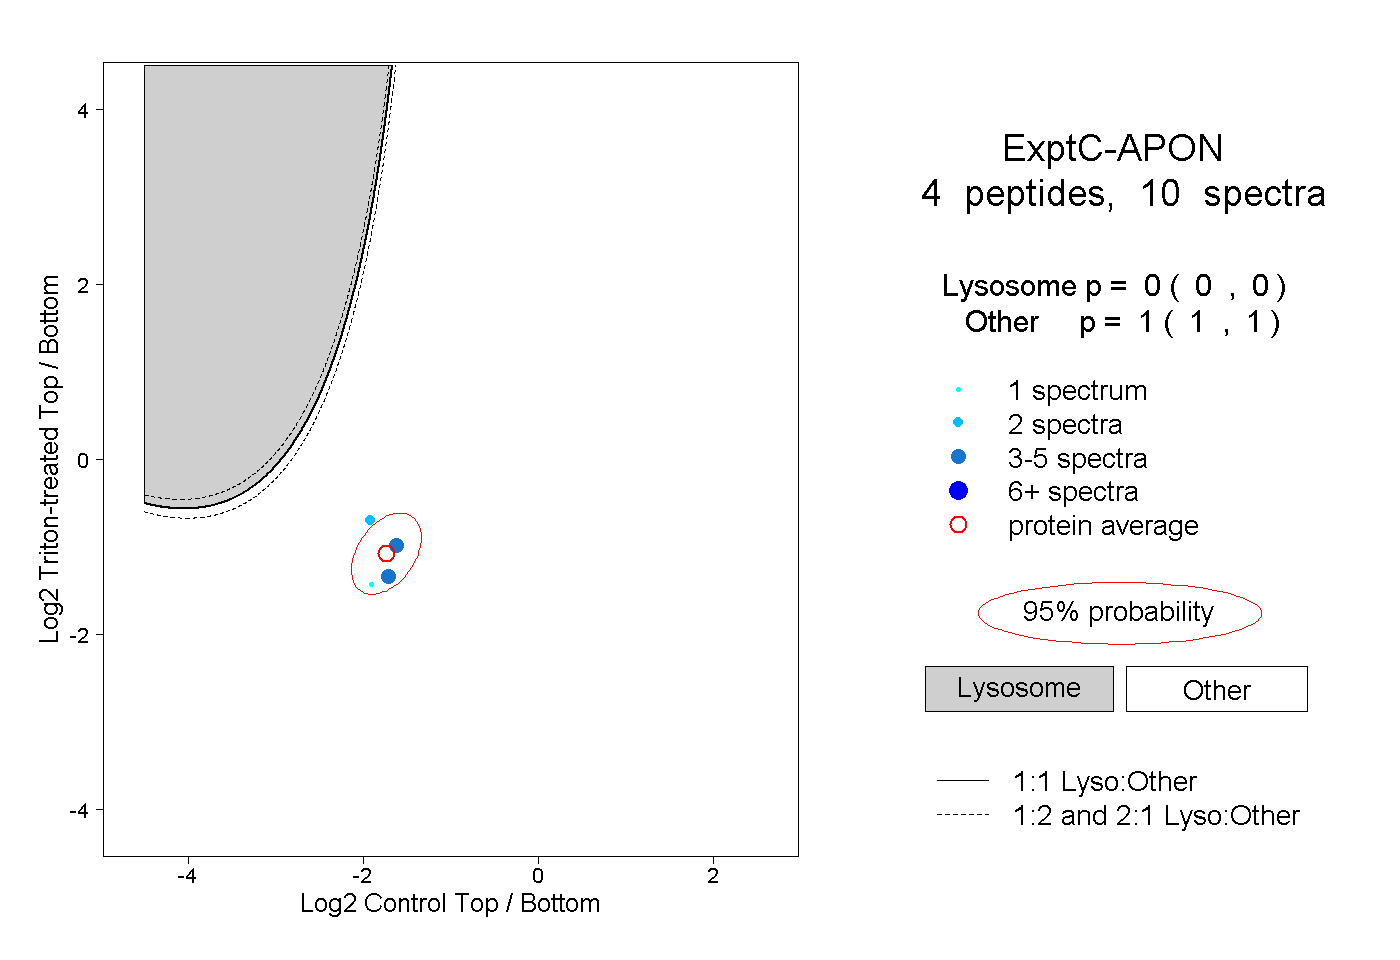 |
0.000 0.000 | 0.000 |
1.000 1.000 | 1.000 |
||||||||
| Plot | Lyso | Other | |||||||||||
| Expt D |
1 peptide |
2 spectra |
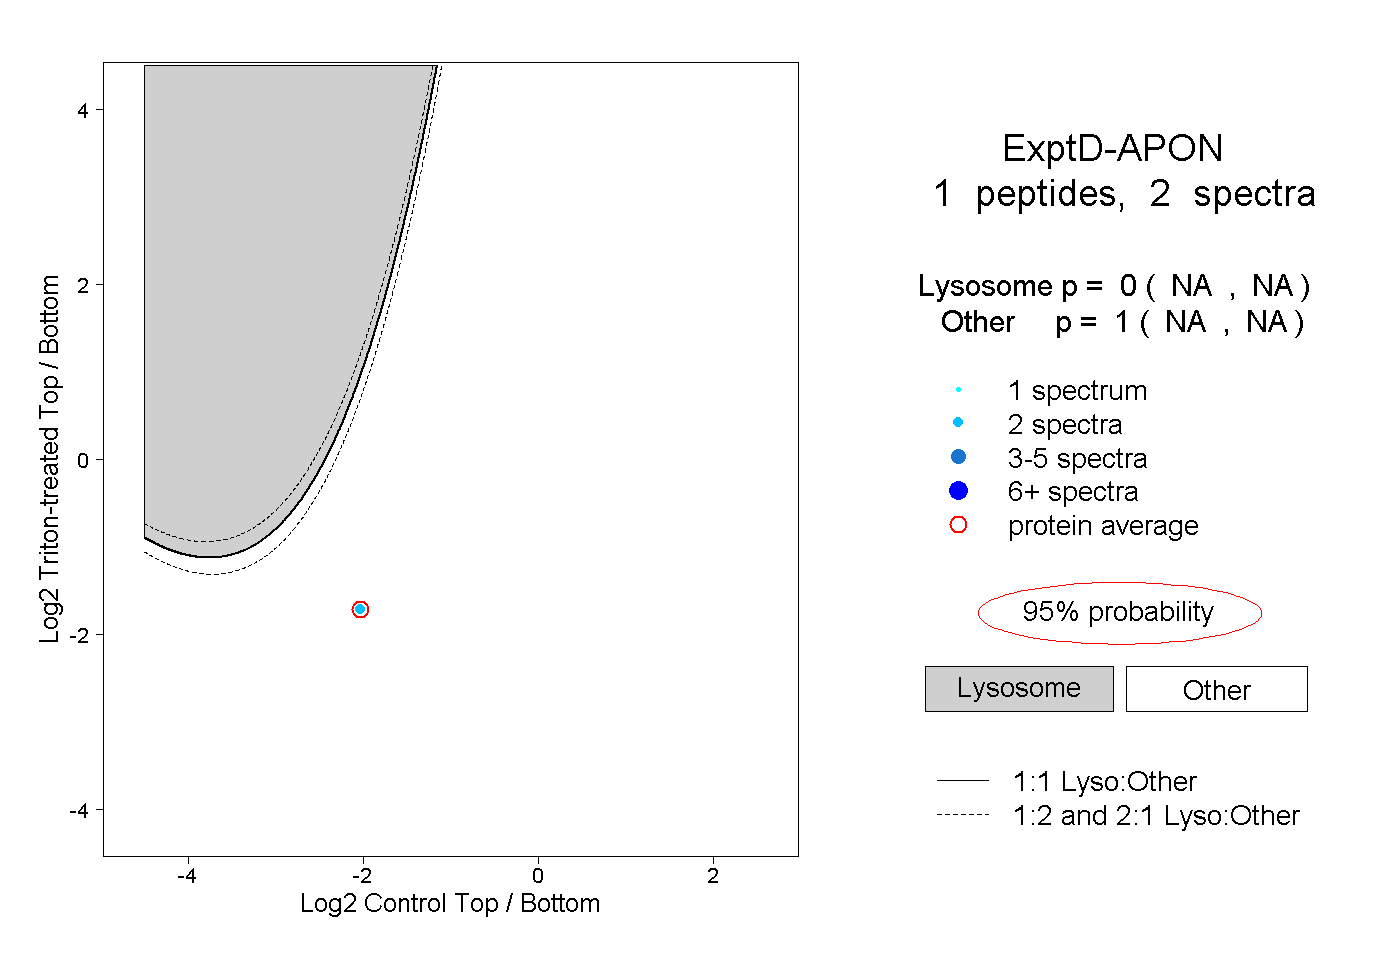 |
0.000 NA | NA |
1.000 NA | NA |