 5
5peptides
spectra
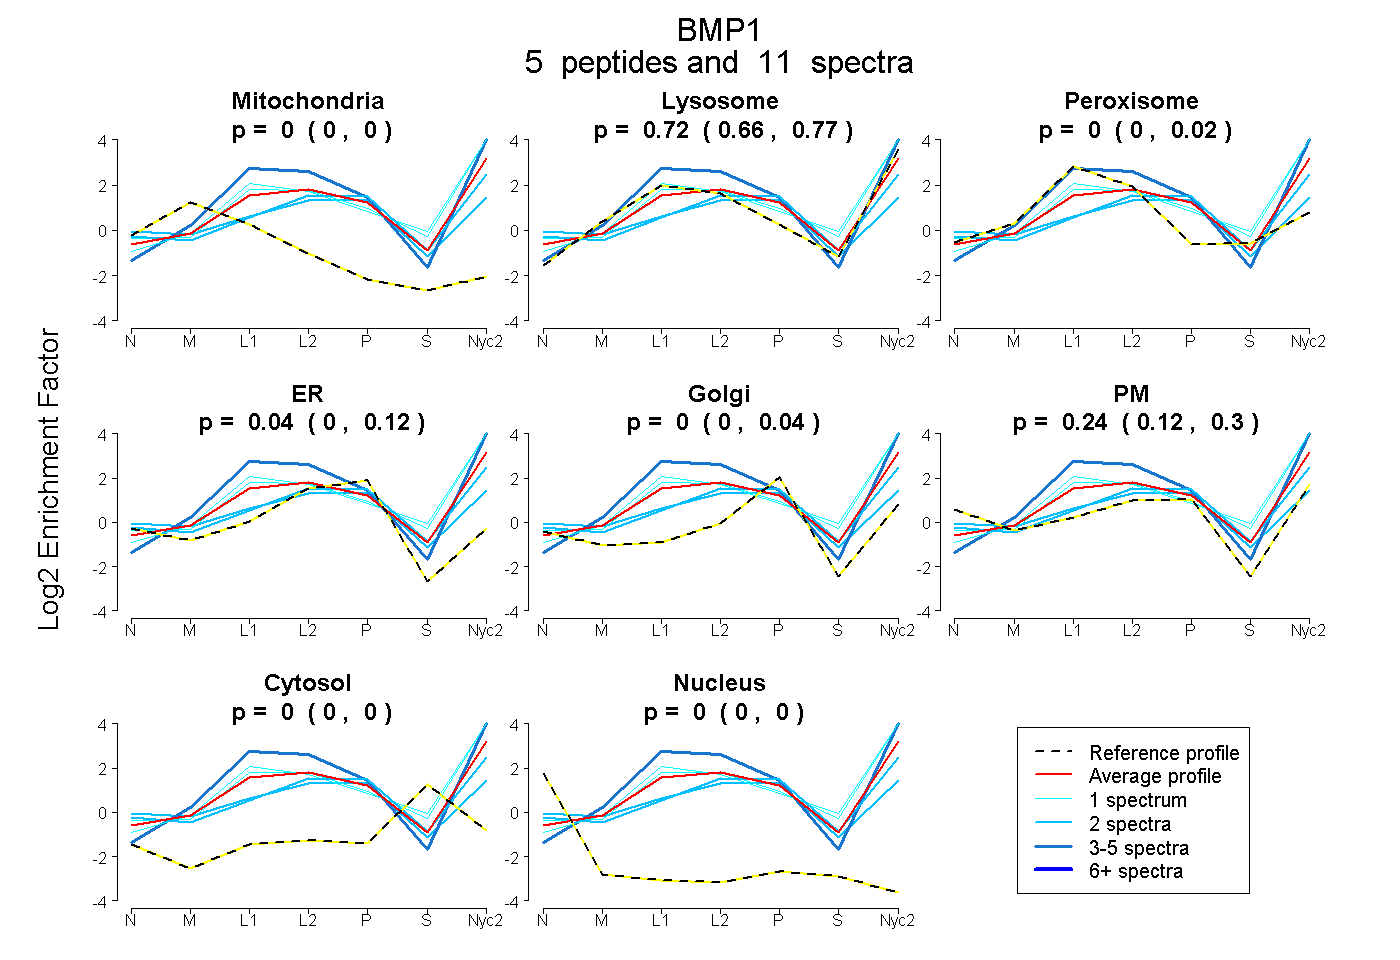
0.000 | 0.000
0.660 | 0.768
0.000 | 0.023
0.000 | 0.123
0.000 | 0.042
0.124 | 0.297
0.000 | 0.000
0.000 | 0.000
| Plot | Mito | Lyso | Perox | ER | Golgi | PM | Cytosol | Nucleus | |||||
| Expt A |
5 peptides |
11 spectra |
|
0.000 0.000 | 0.000 |
0.722 0.660 | 0.768 |
0.000 0.000 | 0.023 |
0.043 0.000 | 0.123 |
0.000 0.000 | 0.042 |
0.235 0.124 | 0.297 |
0.000 0.000 | 0.000 |
0.000 0.000 | 0.000 |
| 2 spectra, EVDECSRPNR | 0.000 | 0.175 | 0.194 | 0.116 | 0.193 | 0.304 | 0.020 | 0.000 | ||
| 1 spectrum, SSSNWVGK | 0.000 | 0.985 | 0.000 | 0.000 | 0.000 | 0.000 | 0.015 | 0.000 | ||
| 5 spectra, LWVEFR | 0.000 | 1.000 | 0.000 | 0.000 | 0.000 | 0.000 | 0.000 | 0.000 | ||
| 2 spectra, YDFVEVR | 0.000 | 0.450 | 0.000 | 0.044 | 0.154 | 0.320 | 0.032 | 0.000 | ||
| 1 spectrum, ISVTPGEK | 0.000 | 0.876 | 0.000 | 0.000 | 0.000 | 0.124 | 0.000 | 0.000 |
| Plot | Lyso | Other | |||||||||||
| Expt C |
14 peptides |
27 spectra |
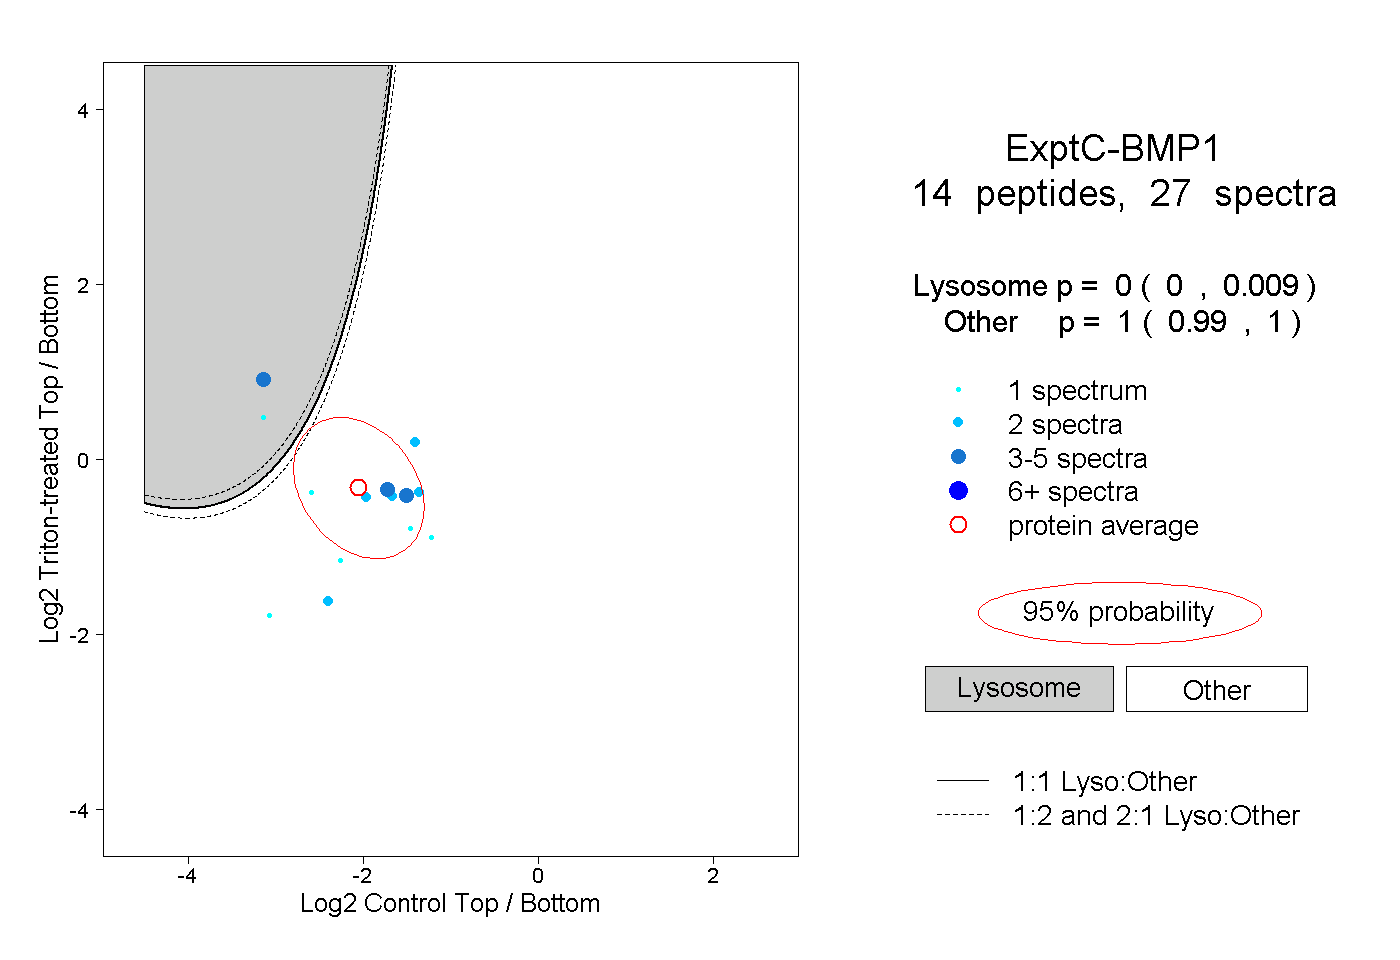 |
0.000 0.000 | 0.009 |
1.000 0.990 | 1.000 |