8
8peptides
spectra
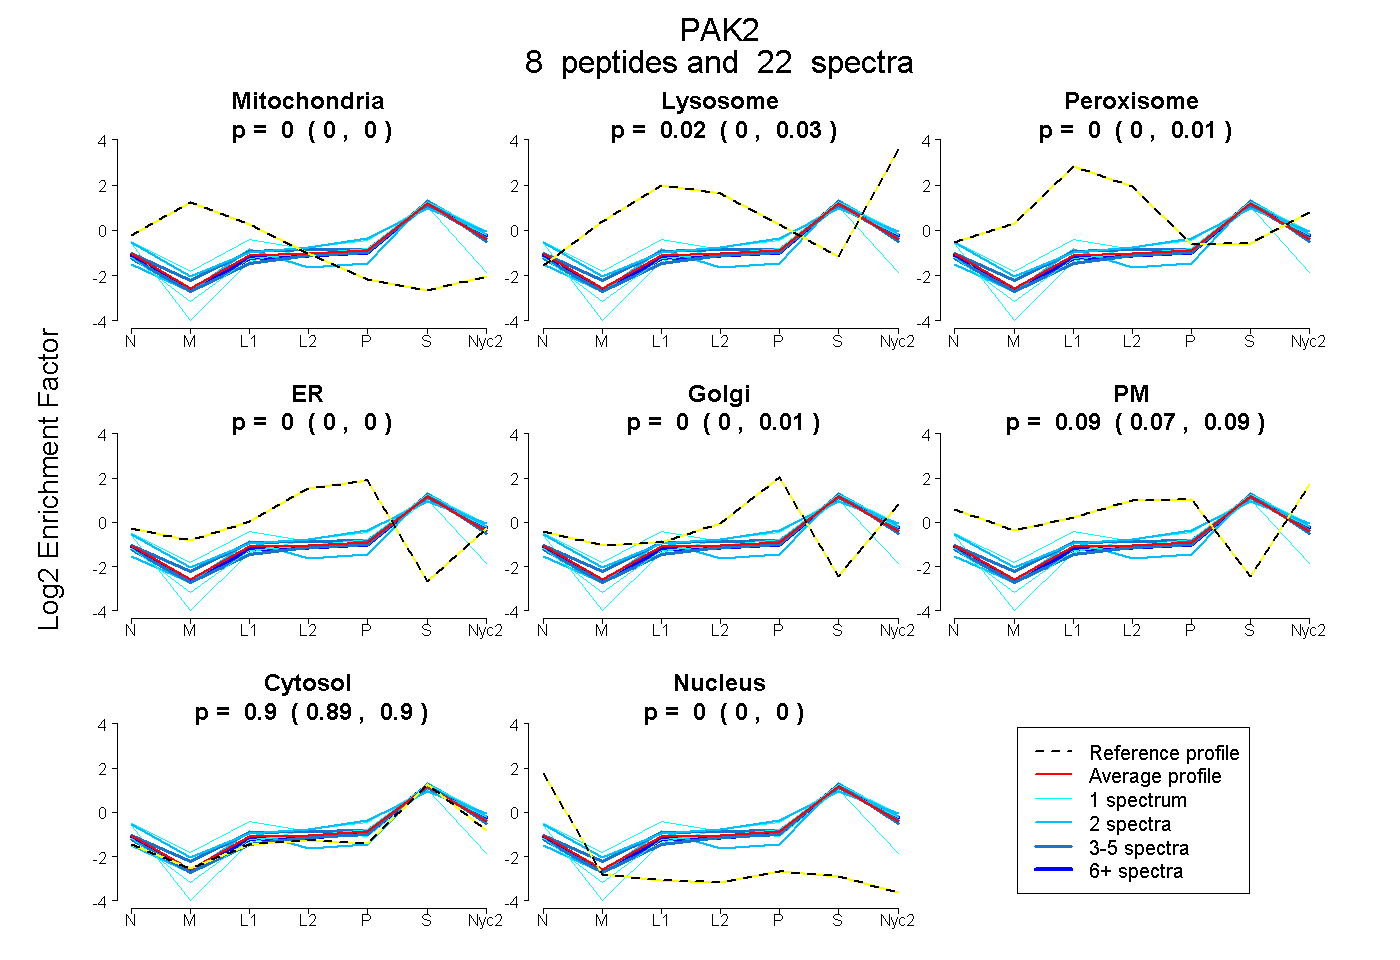
0.000 | 0.000
0.002 | 0.028
0.000 | 0.009
0.000 | 0.000
0.000 | 0.010
0.070 | 0.094
0.888 | 0.903
0.000 | 0.000
3peptides
spectra
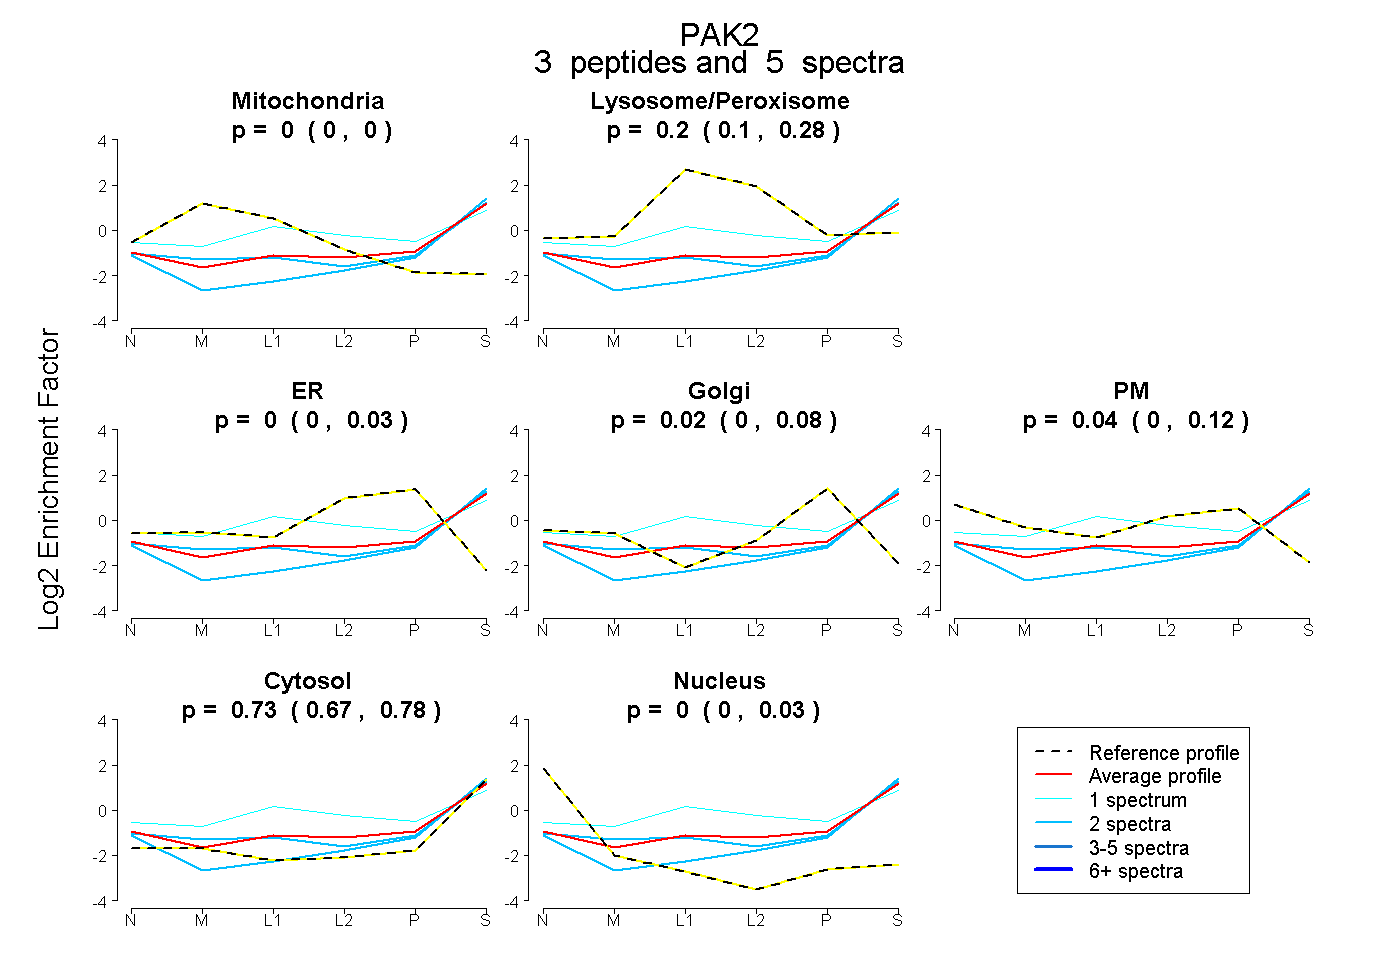
0.000 | 0.000
0.098 | 0.283
0.000 | 0.026
0.000 | 0.084
0.000 | 0.118
0.675 | 0.776
0.000 | 0.034