 22
22peptides
spectra
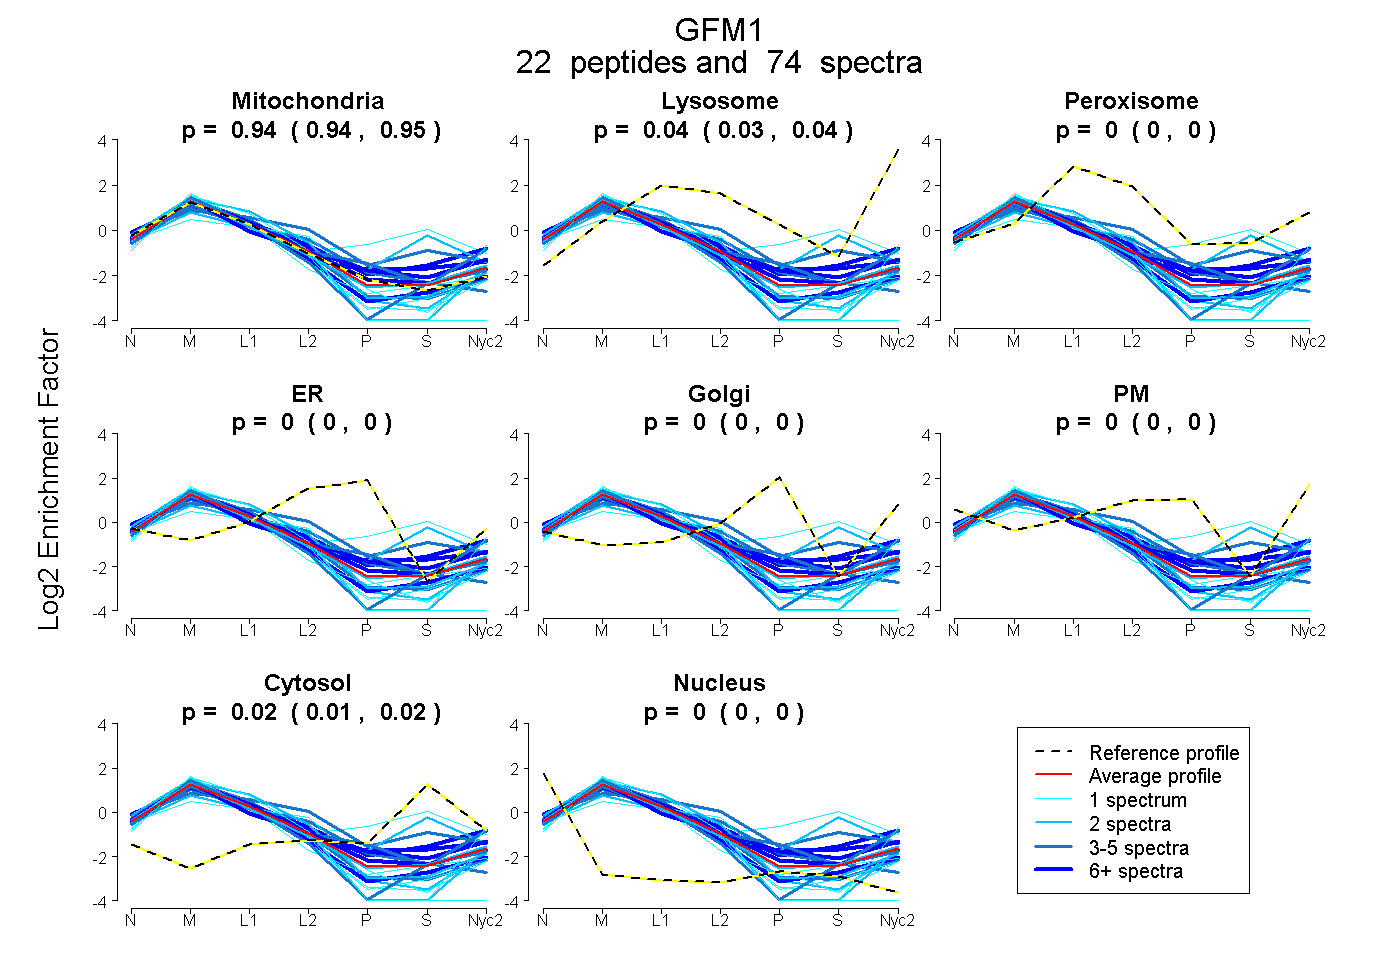
0.937 | 0.948
0.035 | 0.043
0.000 | 0.000
0.000 | 0.000
0.000 | 0.000
0.000 | 0.000
0.012 | 0.022
0.000 | 0.000
9peptides
spectra

0.942 | 0.982
0.014 | 0.043
0.000 | 0.022
0.000 | 0.000
0.000 | 0.000
0.000 | 0.000
0.000 | 0.000
28peptides
spectra

0.000 | 0.000
1.000 | 1.000
6peptides
spectra
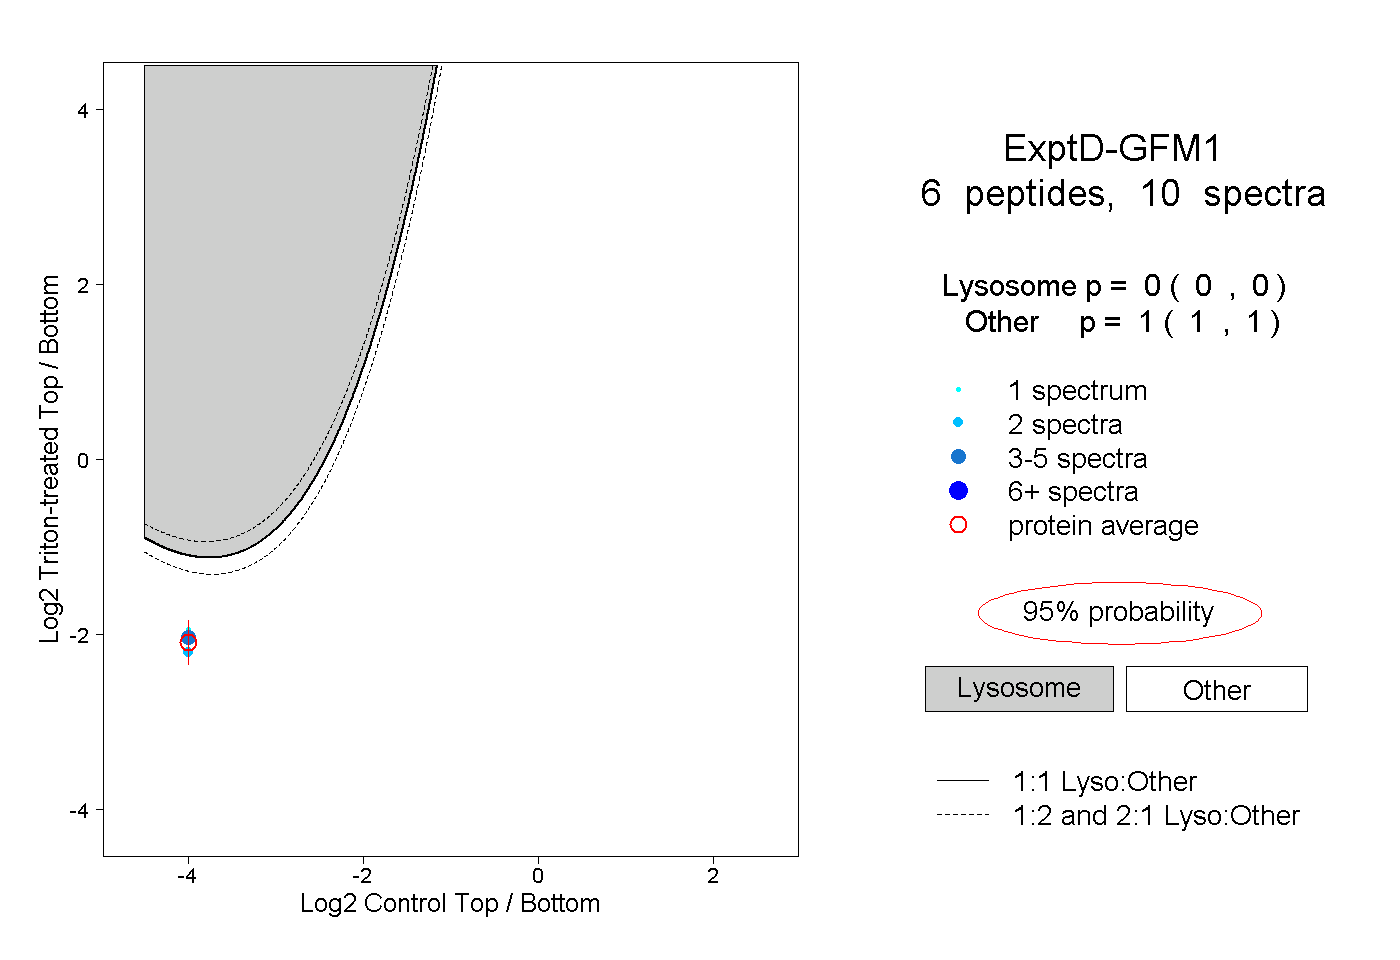
0.000 | 0.000
1.000 | 1.000