 185
185peptides
spectra
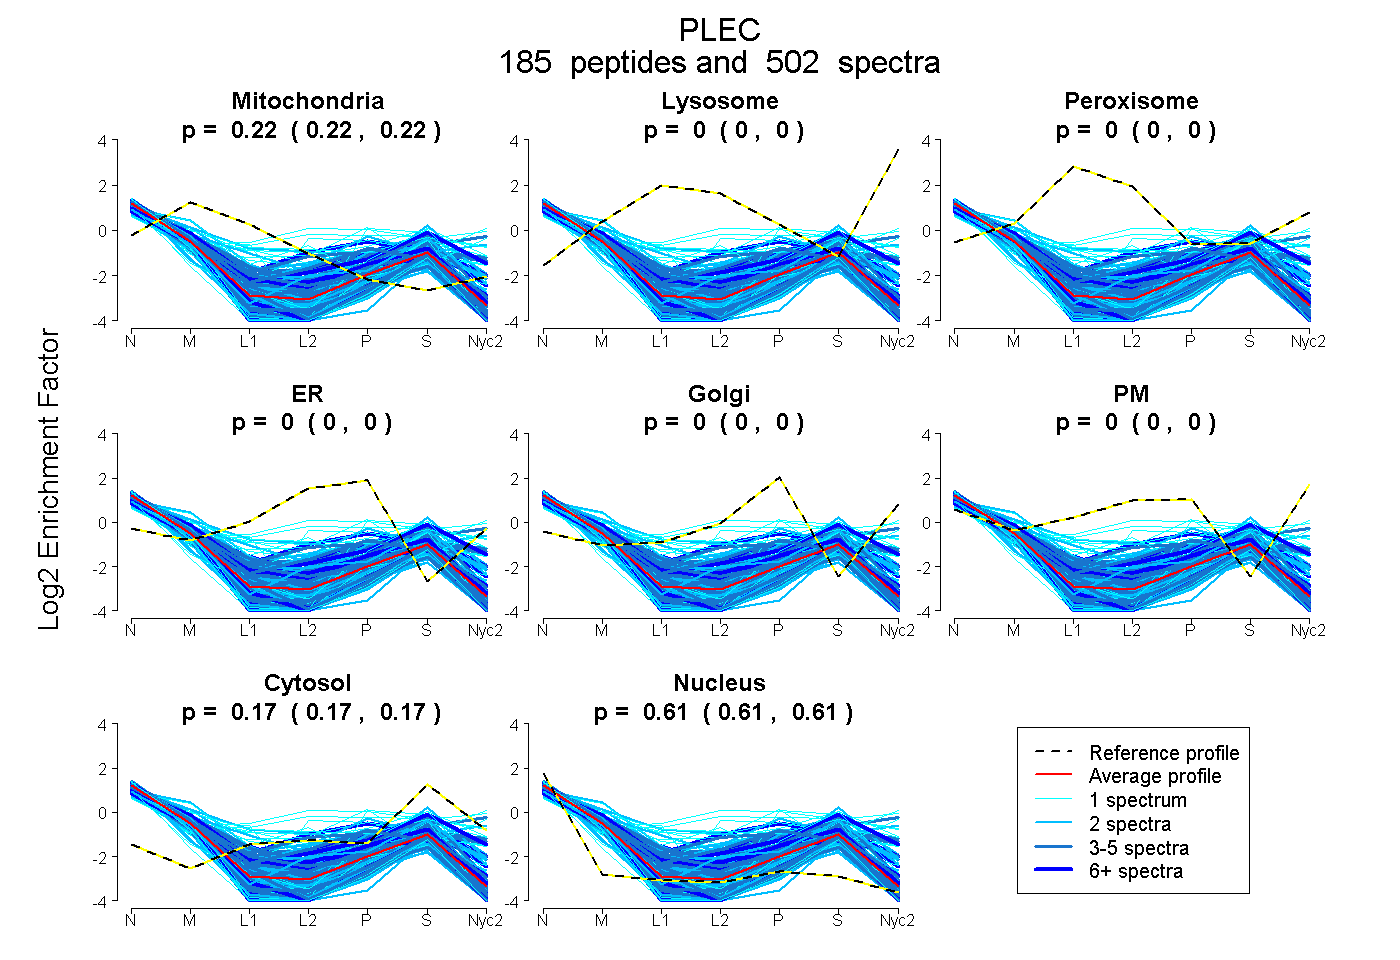
0.223 | 0.224
0.000 | 0.000
0.000 | 0.000
0.000 | 0.000
0.000 | 0.000
0.000 | 0.000
0.169 | 0.170
0.606 | 0.607
81peptides
spectra
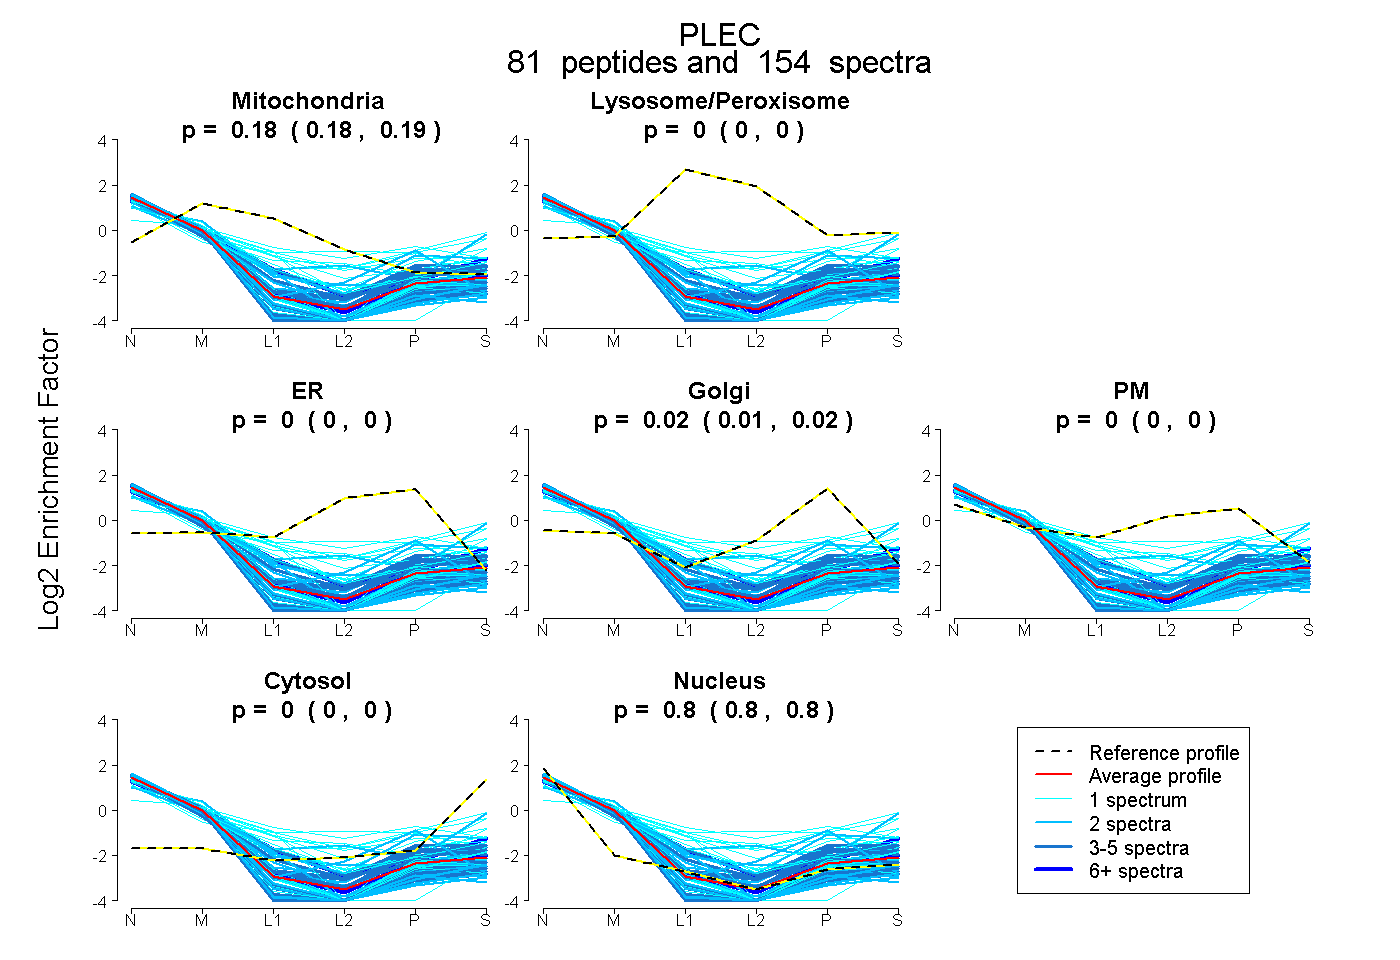
0.182 | 0.187
0.000 | 0.000
0.000 | 0.000
0.014 | 0.019
0.000 | 0.000
0.000 | 0.000
0.797 | 0.800
56peptides
spectra

0.000 | 0.001
0.998 | 1.000
11peptides
spectra

0.000 | 0.001
0.999 | 1.000