 4
4peptides
spectra
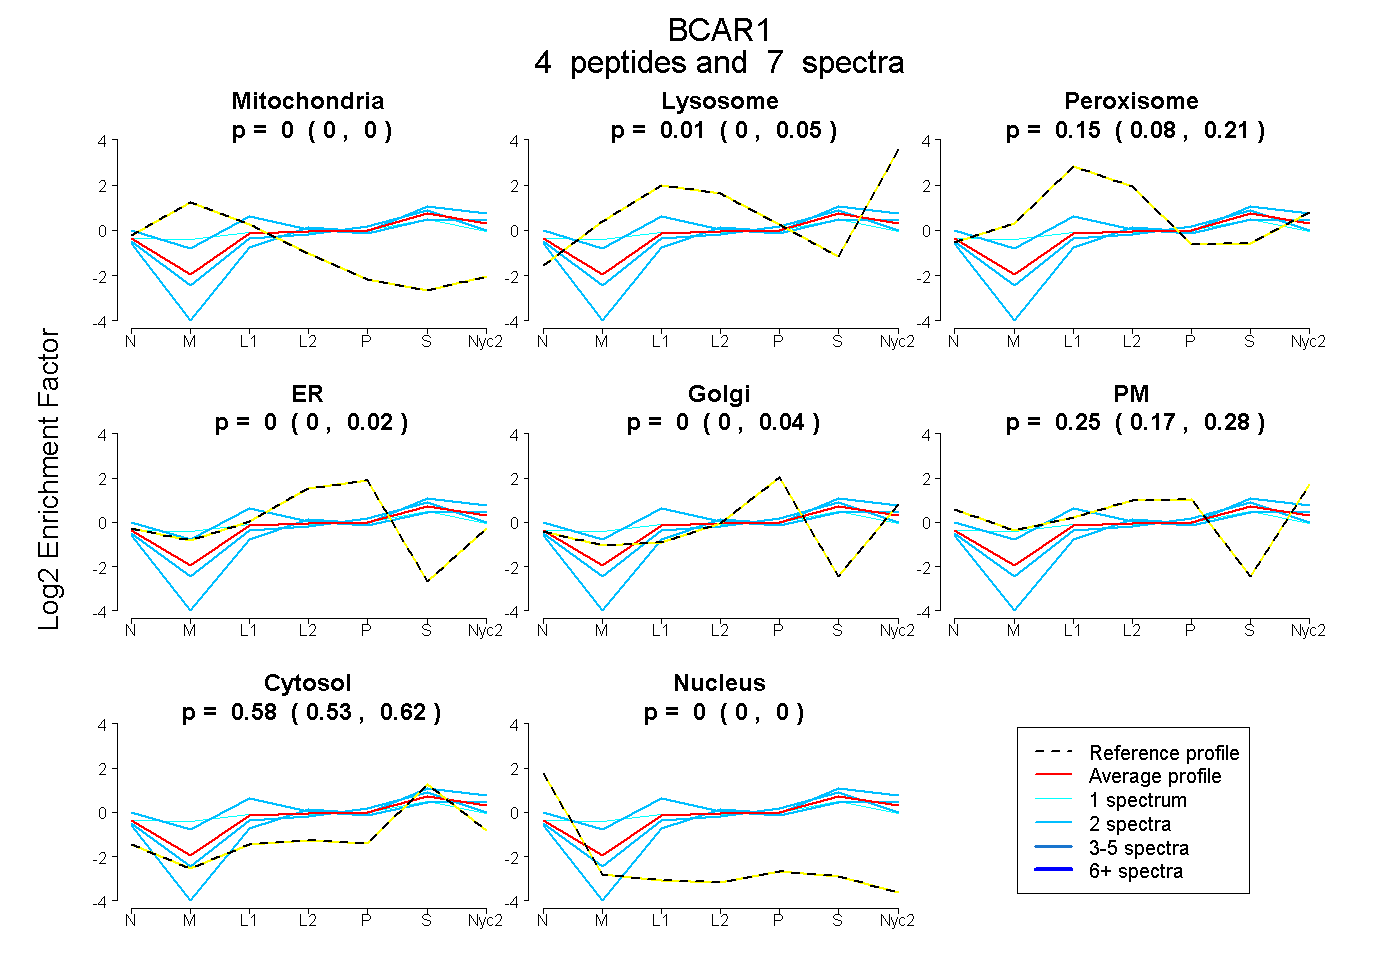
0.000 | 0.000
0.000 | 0.053
0.081 | 0.212
0.000 | 0.024
0.000 | 0.040
0.171 | 0.275
0.534 | 0.622
0.000 | 0.000
4peptides
spectra
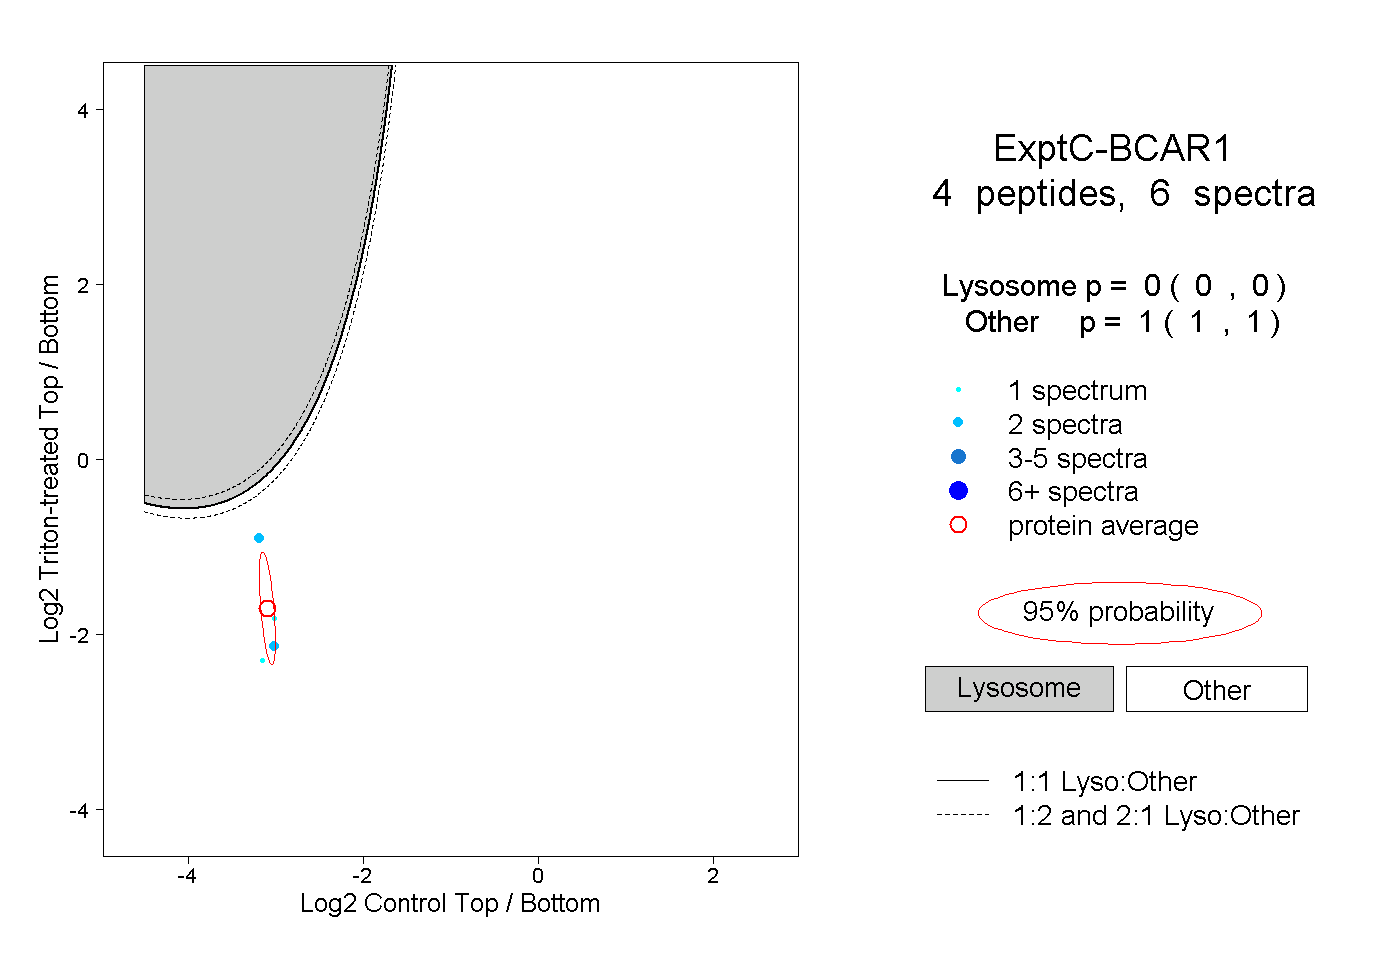
0.000 | 0.000
1.000 | 1.000
1peptide
spectrum
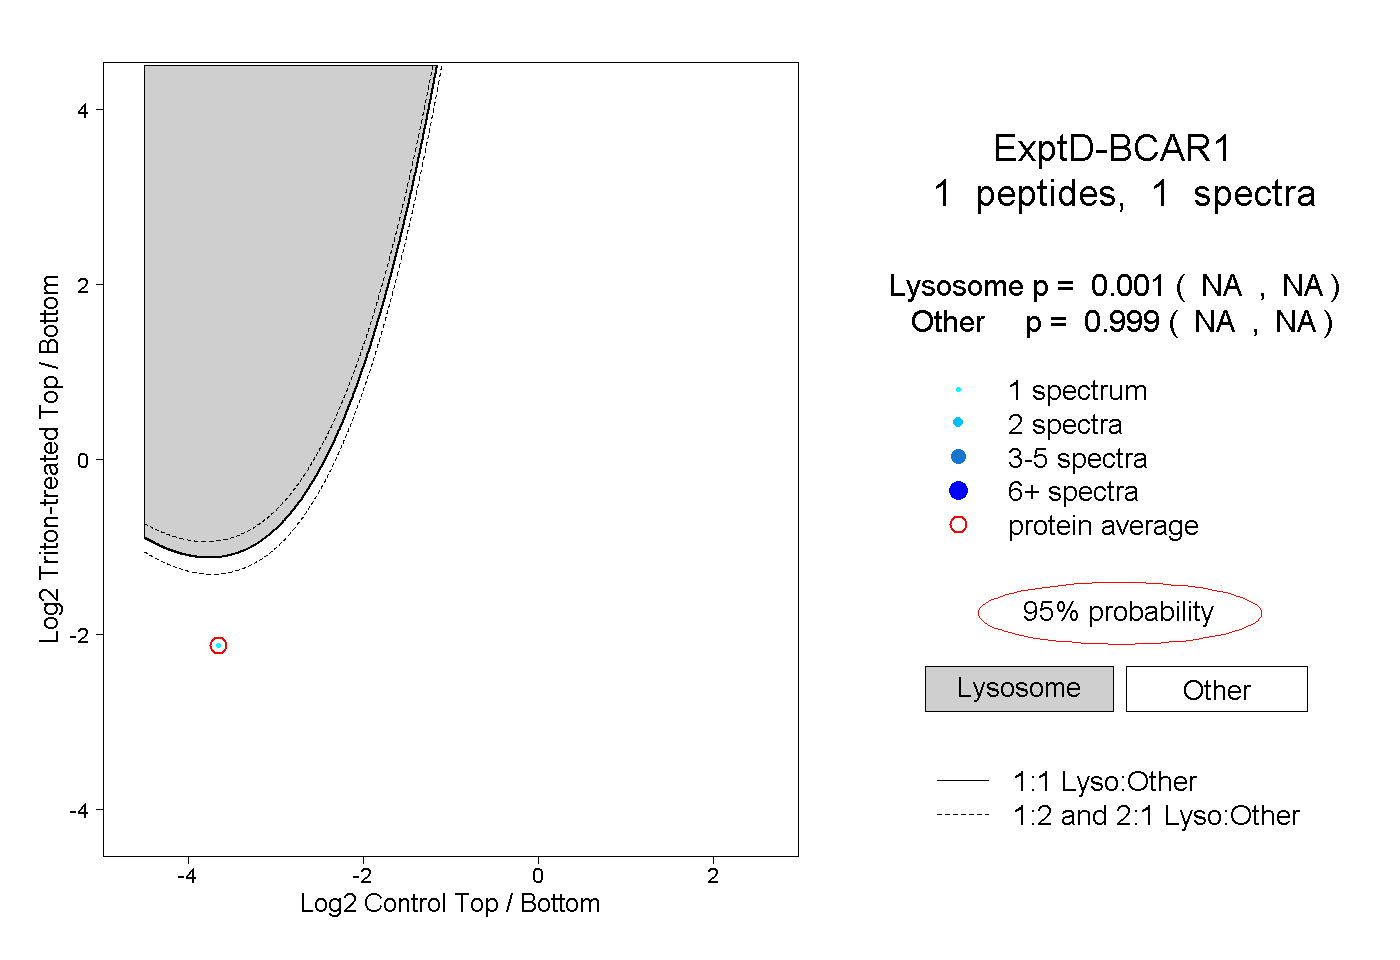
NA | NA
NA | NA