 7
7peptides
spectra
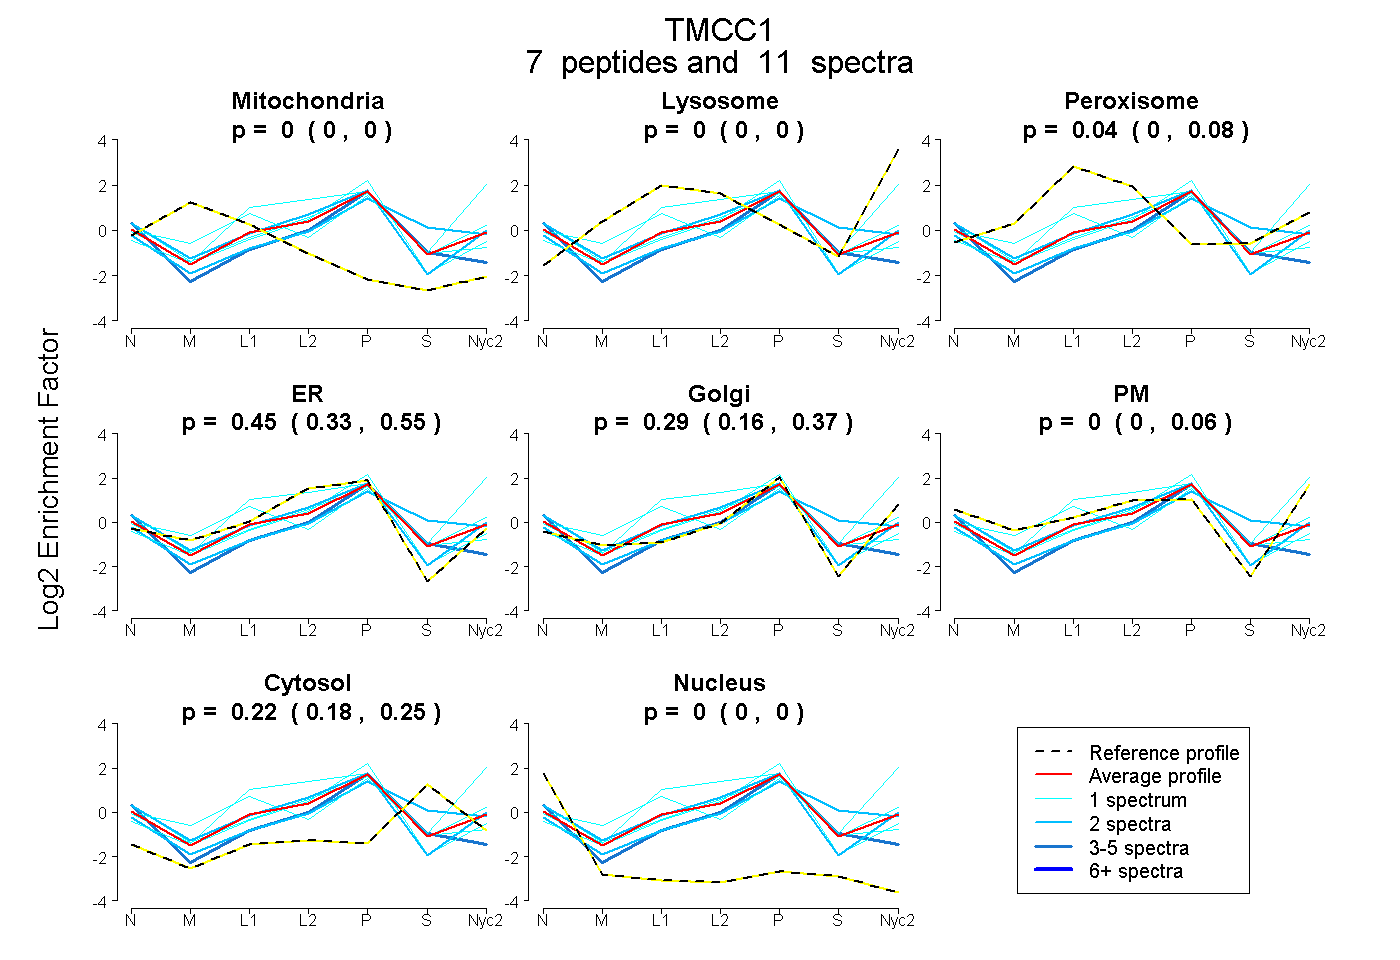
0.000 | 0.000
0.000 | 0.000
0.000 | 0.079
0.333 | 0.553
0.164 | 0.366
0.000 | 0.062
0.183 | 0.245
0.000 | 0.000
| Plot | Mito | Lyso | Perox | ER | Golgi | PM | Cytosol | Nucleus | |||||
| Expt A |
7 peptides |
11 spectra |
|
0.000 0.000 | 0.000 |
0.000 0.000 | 0.000 |
0.043 0.000 | 0.079 |
0.453 0.333 | 0.553 |
0.287 0.164 | 0.366 |
0.000 0.000 | 0.062 |
0.216 0.183 | 0.245 |
0.000 0.000 | 0.000 |
| 3 spectra, DDNVAEYLK | 0.000 | 0.000 | 0.000 | 0.564 | 0.051 | 0.000 | 0.258 | 0.127 | ||
| 1 spectrum, LEESFETLK | 0.000 | 0.000 | 0.000 | 0.564 | 0.307 | 0.000 | 0.122 | 0.007 | ||
| 2 spectra, QELASMEEK | 0.000 | 0.000 | 0.000 | 0.544 | 0.185 | 0.157 | 0.084 | 0.030 | ||
| 1 spectrum, SAQTILQLQK | 0.089 | 0.000 | 0.173 | 0.303 | 0.275 | 0.000 | 0.149 | 0.011 | ||
| 1 spectrum, EVEQNGIPR | 0.000 | 0.000 | 0.000 | 0.370 | 0.178 | 0.237 | 0.215 | 0.000 | ||
| 1 spectrum, DSLEEGQVDDGGK | 0.000 | 0.355 | 0.000 | 0.212 | 0.081 | 0.286 | 0.065 | 0.000 | ||
| 2 spectra, DIQEALEACQTR | 0.000 | 0.000 | 0.000 | 0.248 | 0.309 | 0.000 | 0.442 | 0.000 |
| Plot | Lyso | Other | |||||||||||
| Expt C |
3 peptides |
5 spectra |
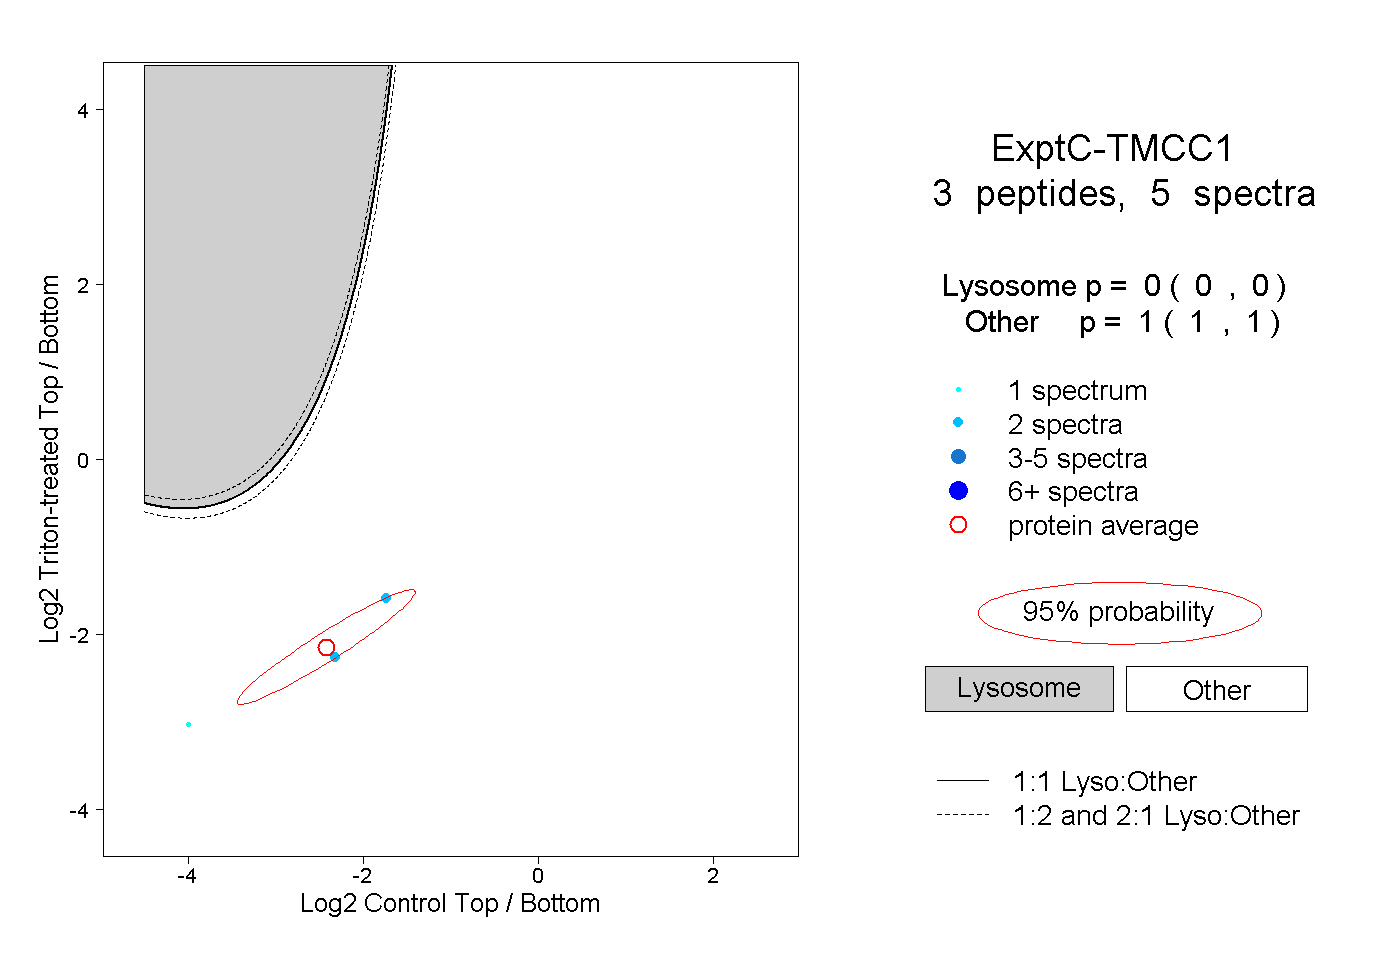 |
0.000 0.000 | 0.000 |
1.000 1.000 | 1.000 |