 3
3peptides
spectra
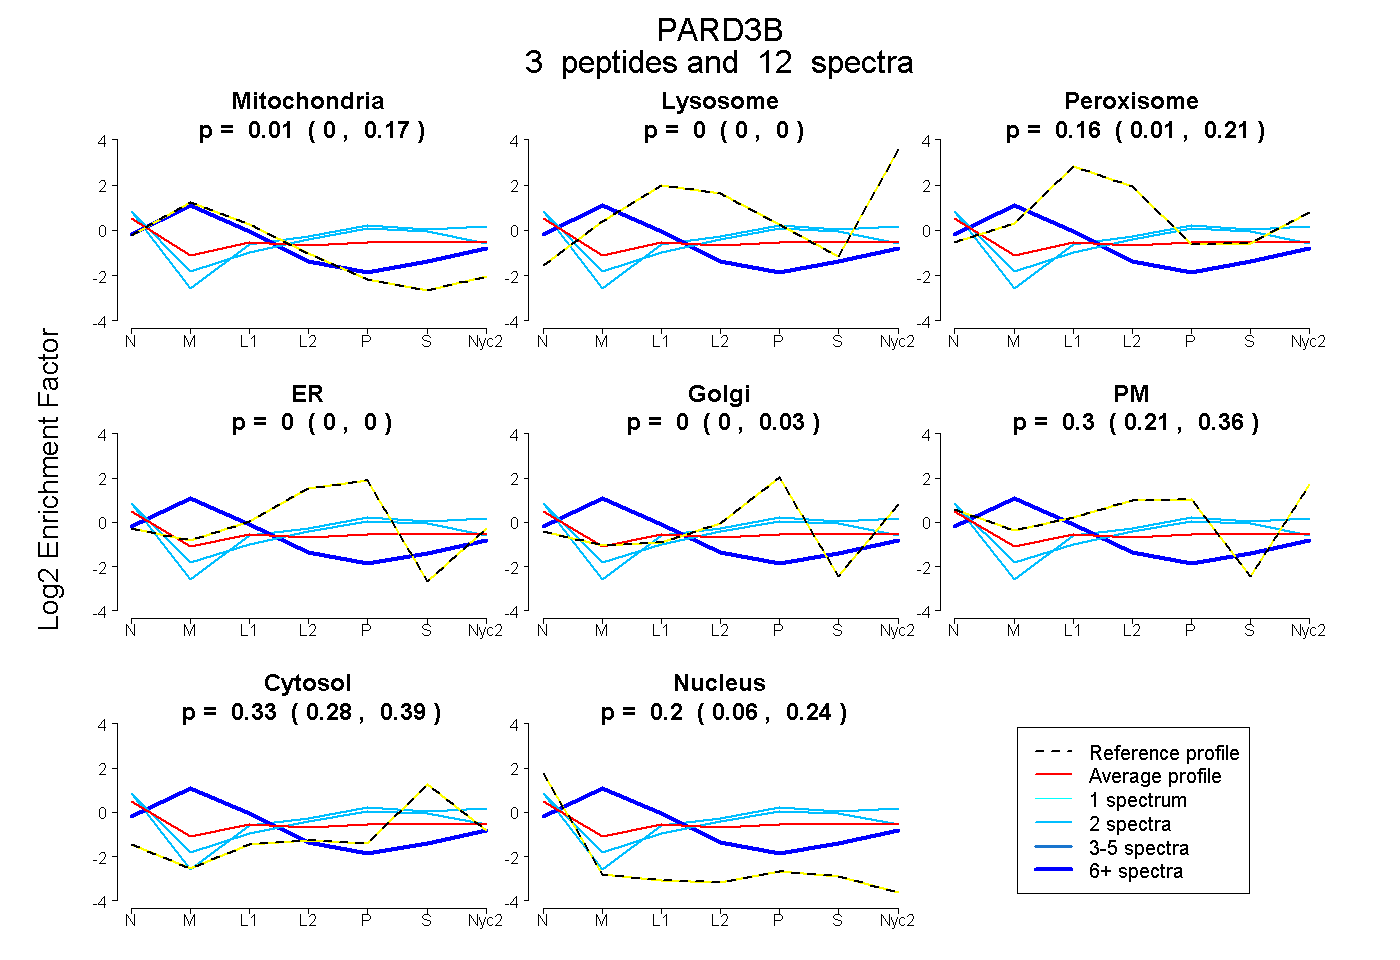
0.000 | 0.175
0.000 | 0.000
0.014 | 0.209
0.000 | 0.000
0.000 | 0.033
0.213 | 0.361
0.276 | 0.392
0.063 | 0.235
| Plot | Mito | Lyso | Perox | ER | Golgi | PM | Cytosol | Nucleus | |||||
| Expt A |
3 peptides |
12 spectra |
|
0.013 0.000 | 0.175 |
0.000 0.000 | 0.000 |
0.163 0.014 | 0.209 |
0.000 0.000 | 0.000 |
0.000 0.000 | 0.033 |
0.297 0.213 | 0.361 |
0.328 0.276 | 0.392 |
0.200 0.063 | 0.235 |
| 2 spectra, TQEELVAMLR | 0.000 | 0.000 | 0.000 | 0.074 | 0.000 | 0.340 | 0.453 | 0.133 | ||
| 8 spectra, ILGLFIR | 0.724 | 0.105 | 0.000 | 0.000 | 0.000 | 0.000 | 0.171 | 0.000 | ||
| 2 spectra, APPTPR | 0.000 | 0.000 | 0.000 | 0.000 | 0.000 | 0.444 | 0.501 | 0.055 |
| Plot | Lyso | Other | |||||||||||
| Expt C |
2 peptides |
3 spectra |
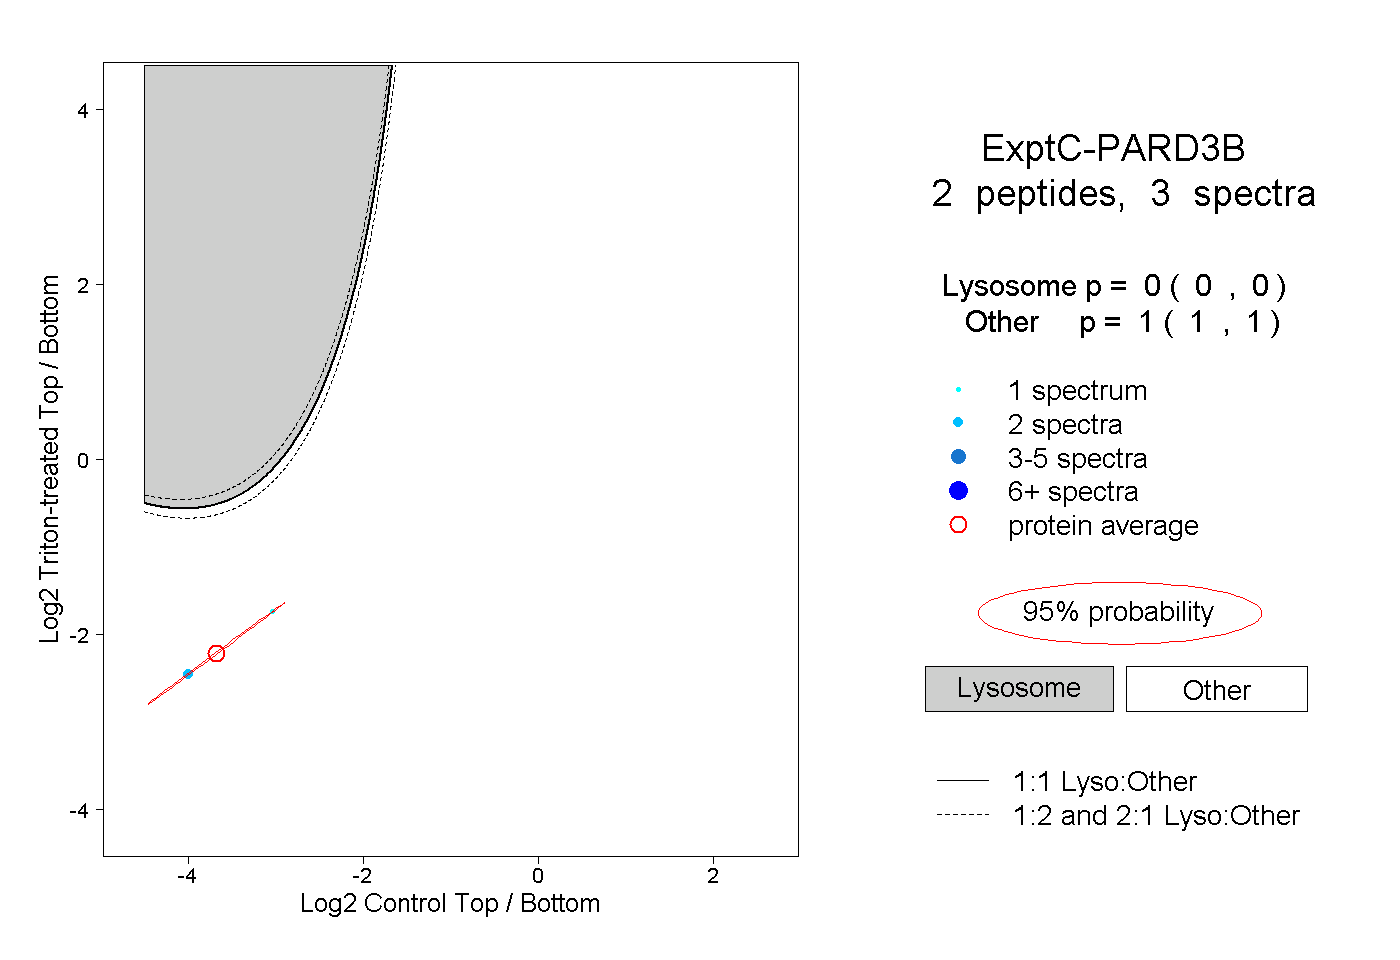 |
0.000 0.000 | 0.000 |
1.000 1.000 | 1.000 |