14
14peptides
spectra
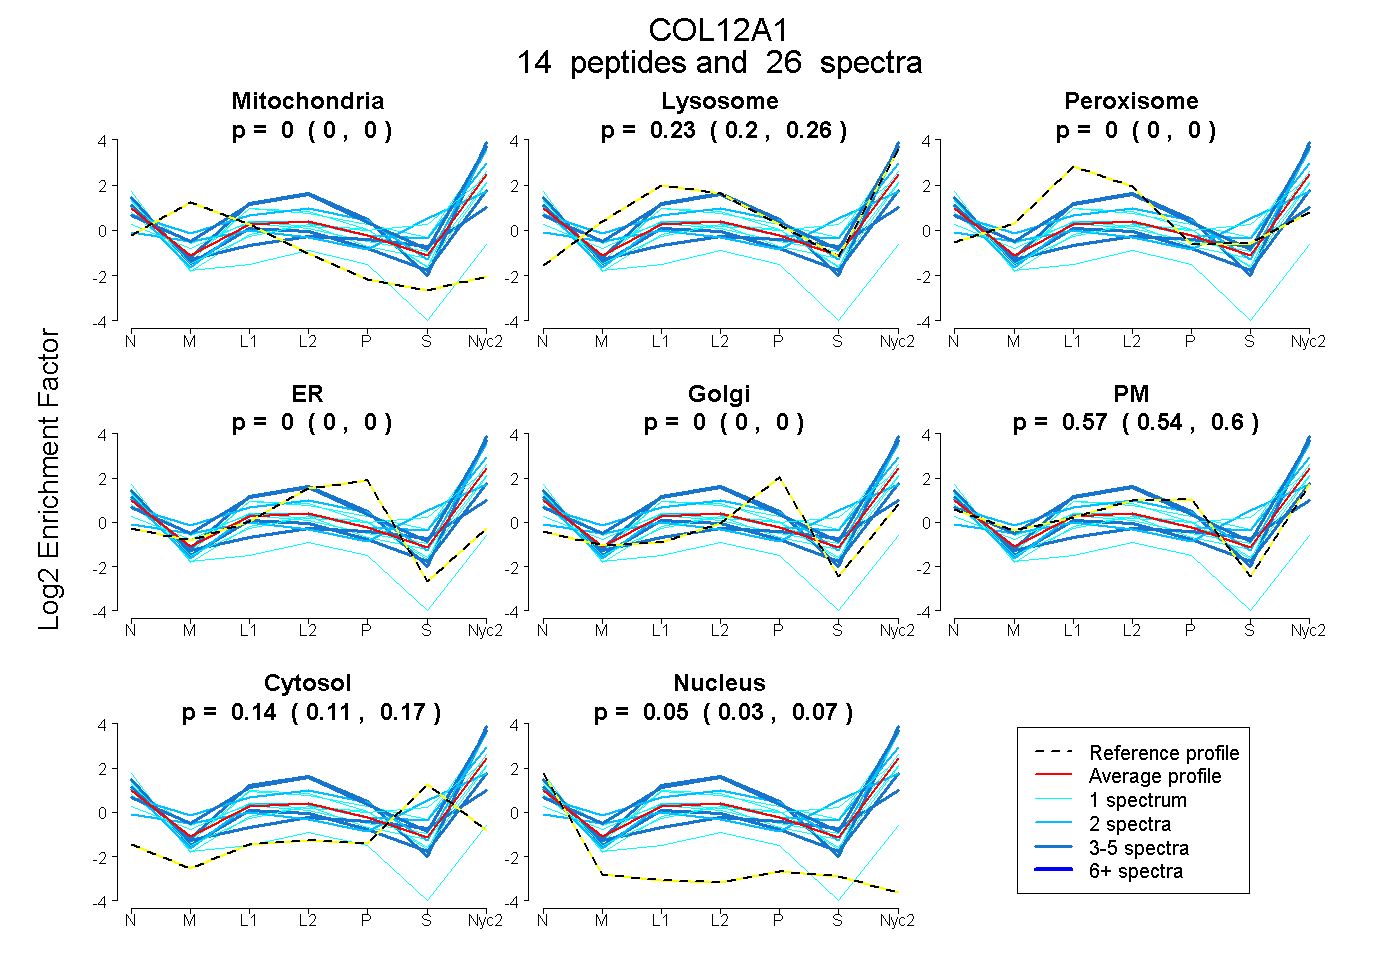
0.000 | 0.000
0.200 | 0.260
0.000 | 0.000
0.000 | 0.000
0.000 | 0.000
0.541 | 0.602
0.114 | 0.167
0.027 | 0.068
1peptide
spectrum
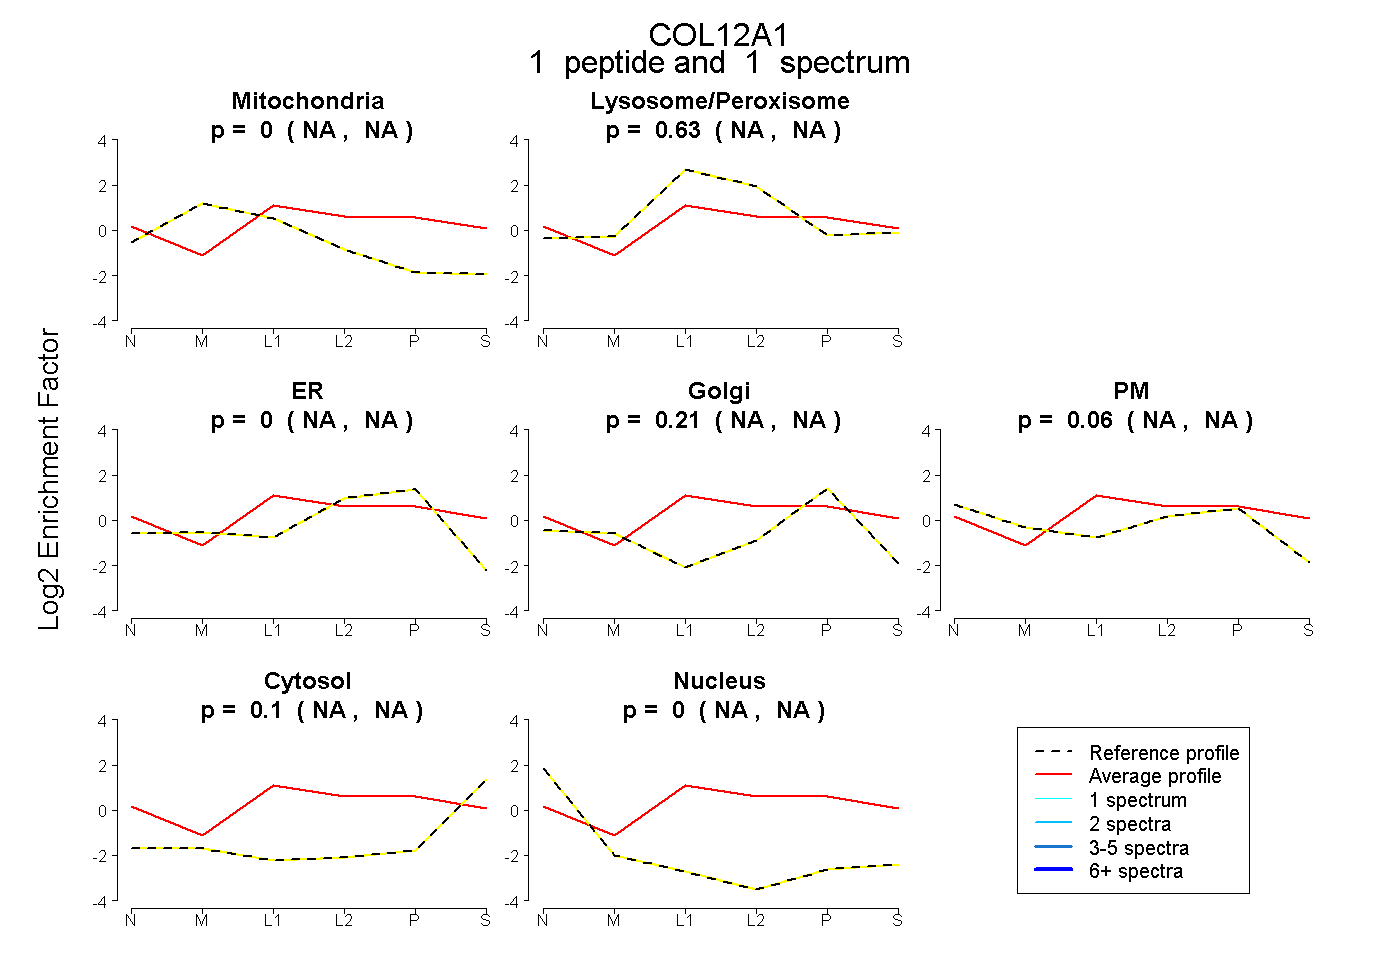
NA | NA
NA | NA
NA | NA
NA | NA
NA | NA
NA | NA
NA | NA
14peptides
spectra
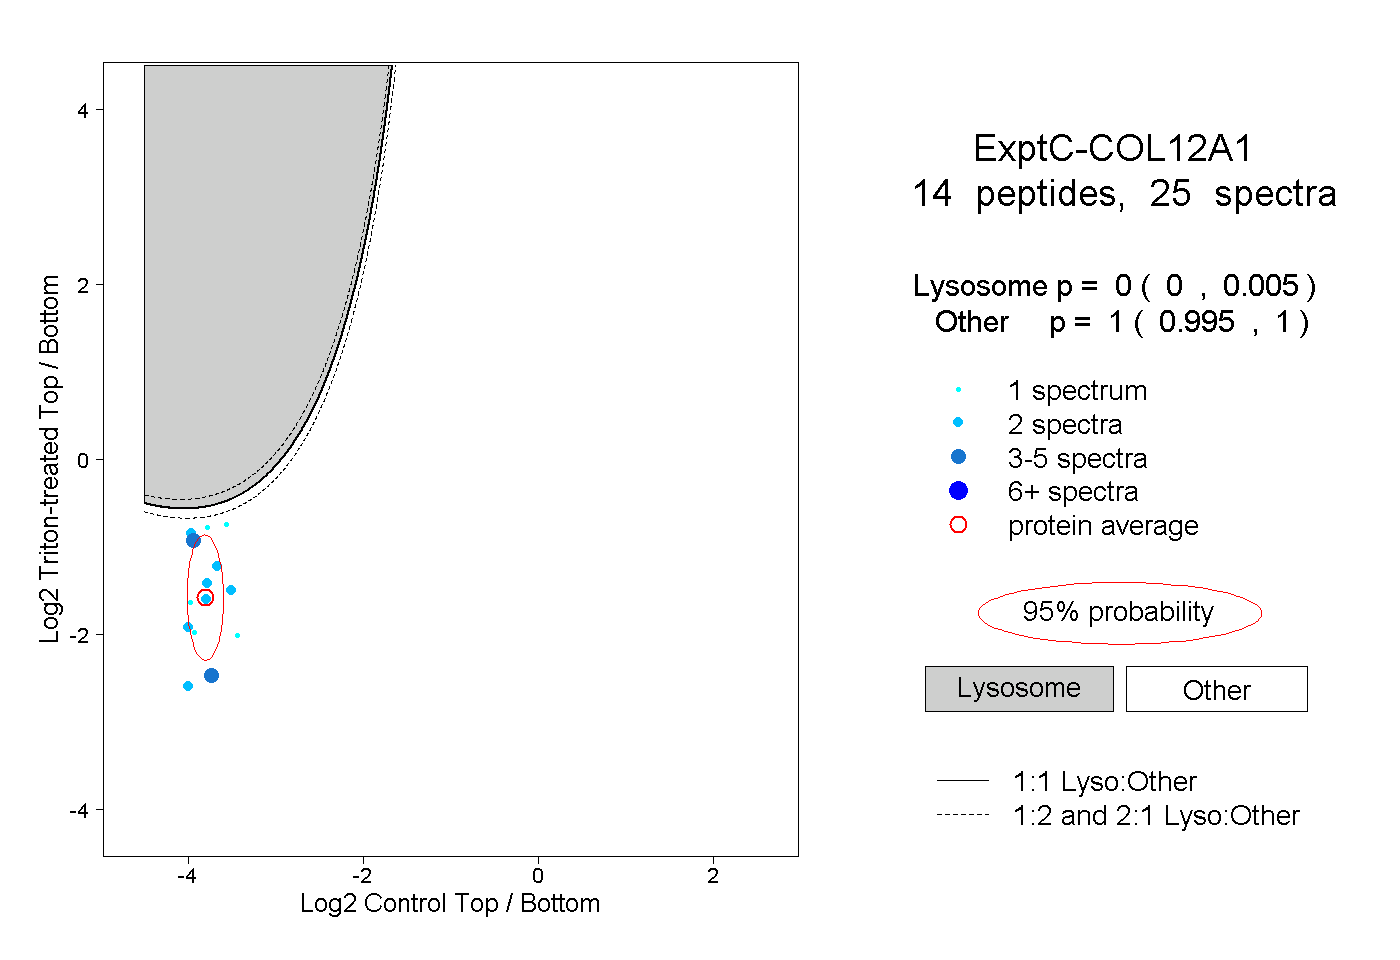
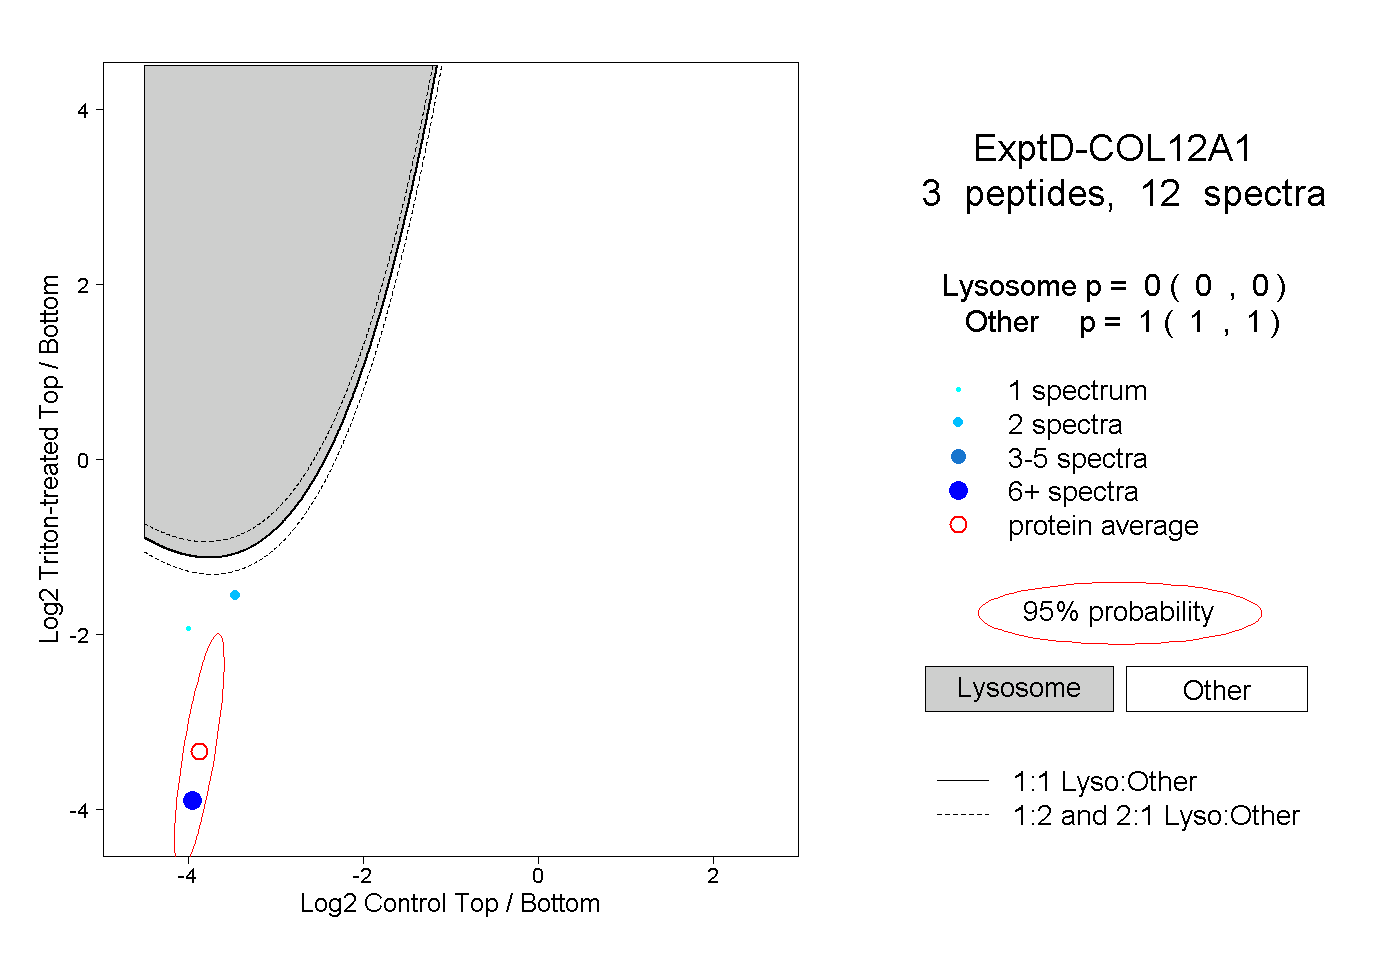
0.000 | 0.005
0.995 | 1.000