 1
1peptide
spectra
0.000 | 0.000
0.000 | 0.000
0.000 | 0.000
0.569 | 0.630
0.000 | 0.000
0.000 | 0.000
0.021 | 0.106
0.297 | 0.358
1peptide
spectra

0.000 | 0.000
1.000 | 1.000
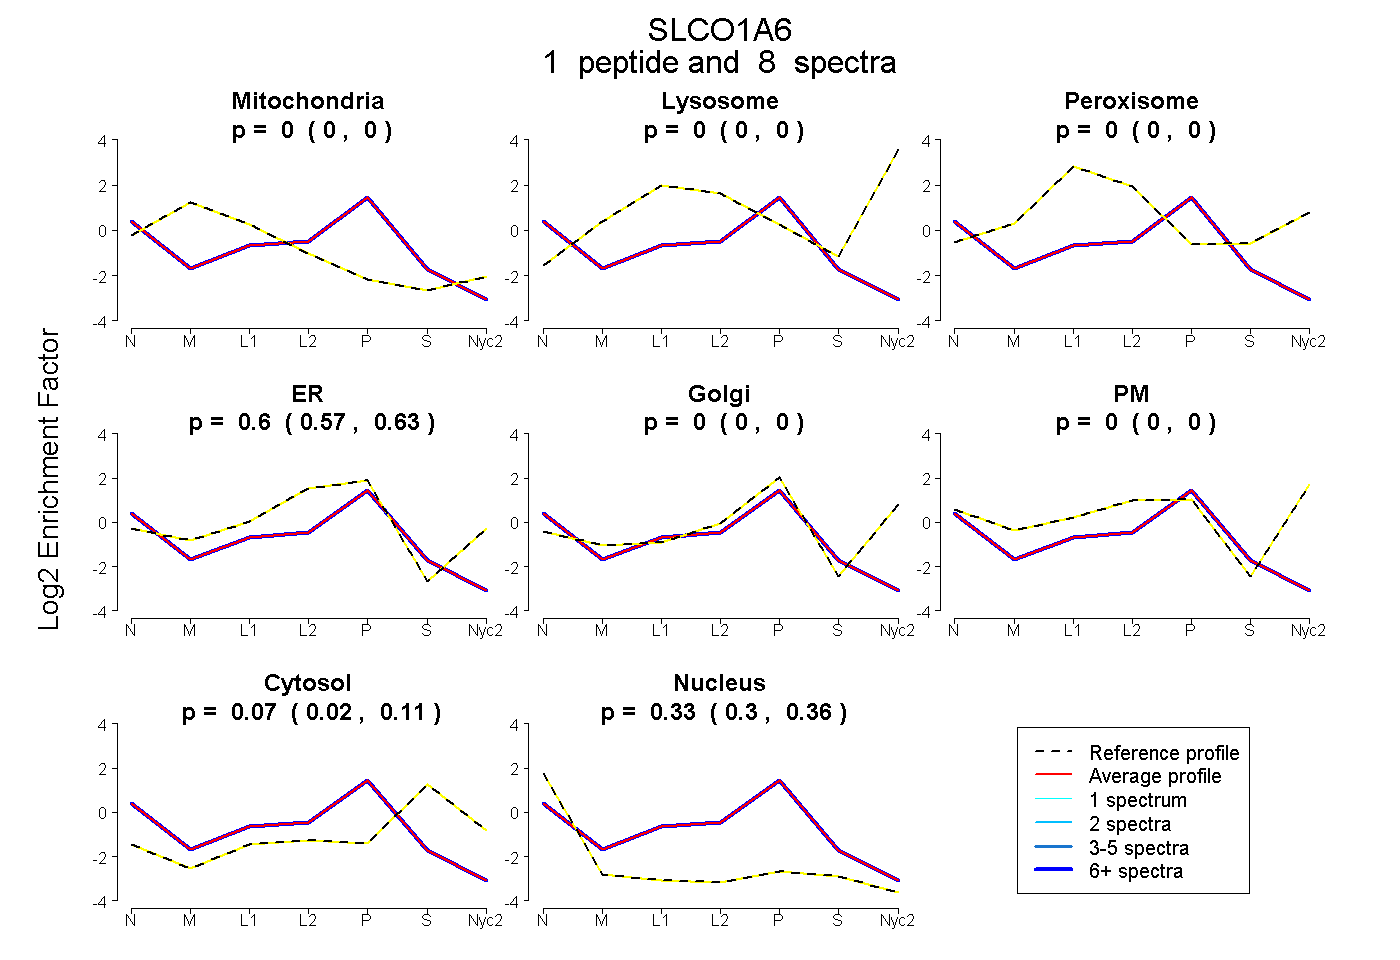
| Plot | Mito | Lyso | Perox | ER | Golgi | PM | Cytosol | Nucleus | |||||
| Expt A |
1 peptide |
8 spectra |
|
0.000 0.000 | 0.000 |
0.000 0.000 | 0.000 |
0.000 0.000 | 0.000 |
0.603 0.569 | 0.630 |
0.000 0.000 | 0.000 |
0.000 0.000 | 0.000 |
0.066 0.021 | 0.106 |
0.331 0.297 | 0.358 |
||
| Plot | Lyso | Other | |||||||||||
| Expt C |
1 peptide |
32 spectra |
|
0.000 0.000 | 0.000 |
1.000 1.000 | 1.000 |