11
11peptides
spectra
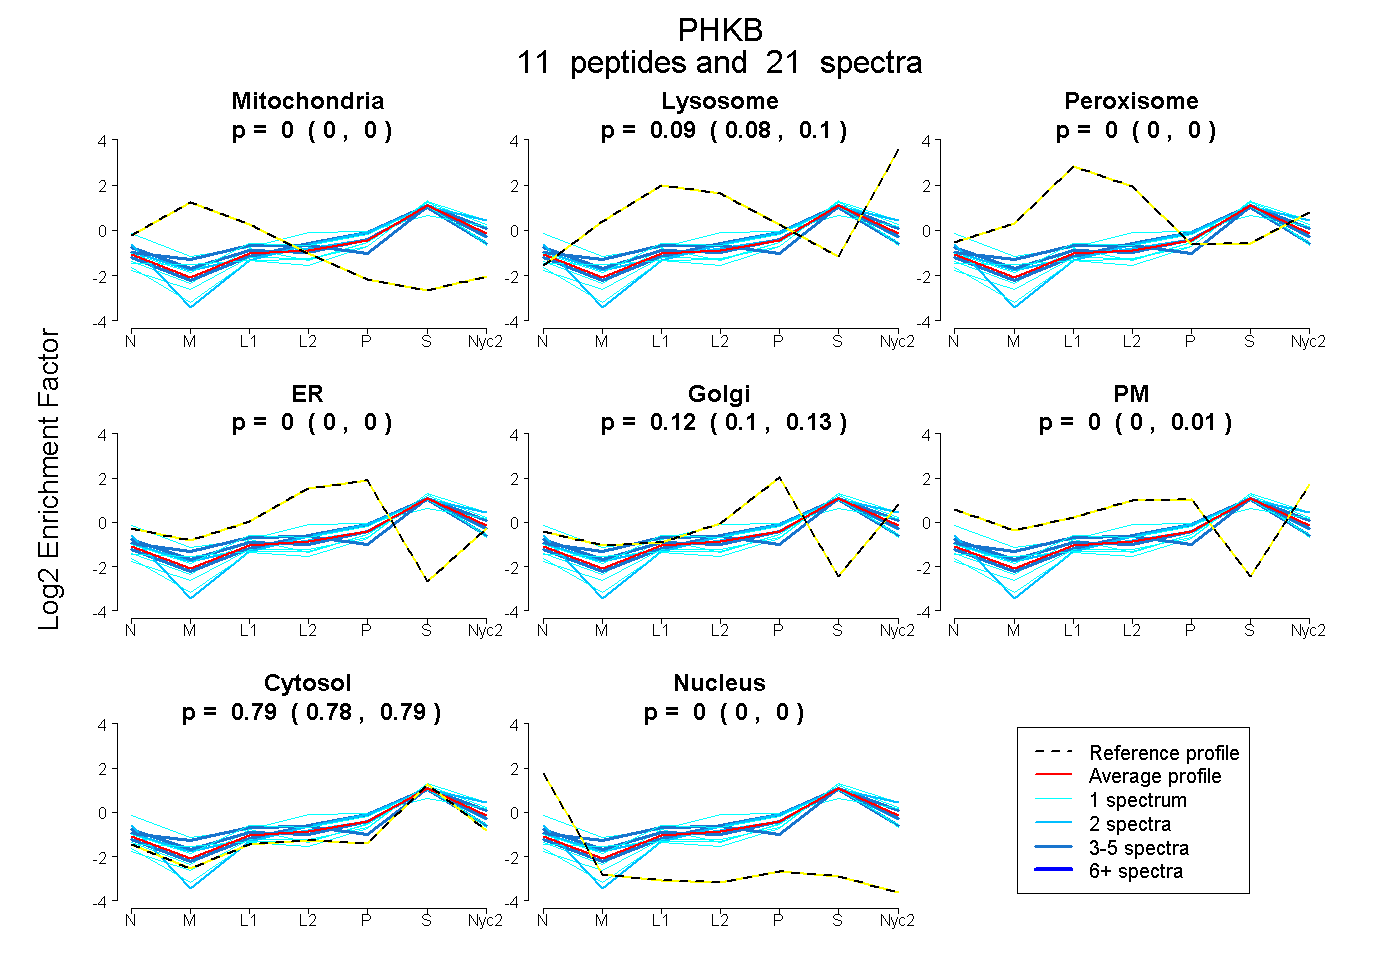
0.000 | 0.000
0.082 | 0.102
0.000 | 0.002
0.000 | 0.000
0.104 | 0.126
0.000 | 0.008
0.781 | 0.795
0.000 | 0.000
4peptides
spectra
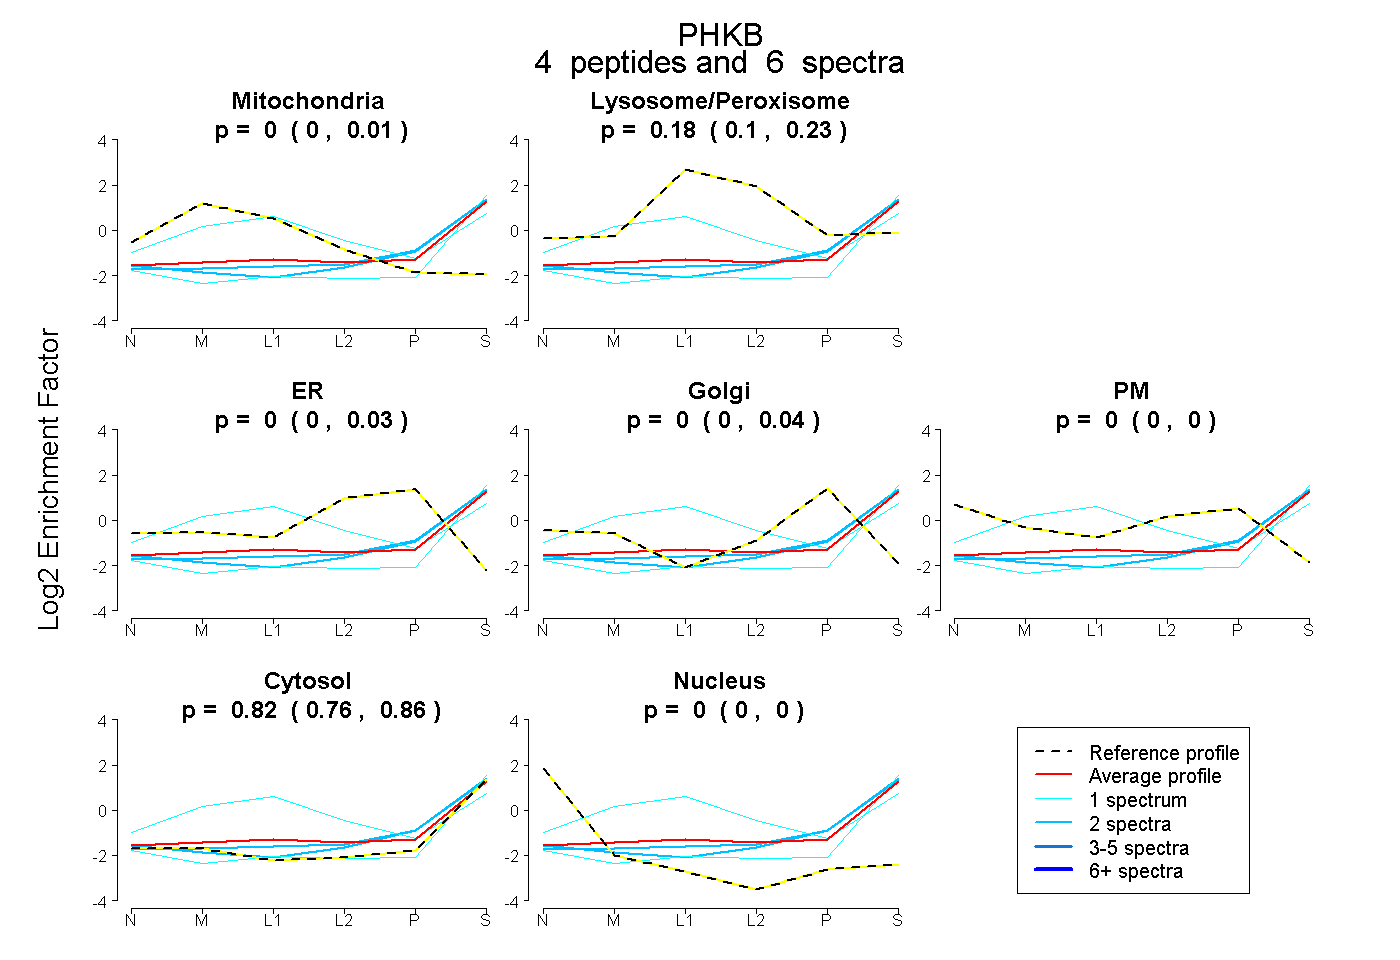
0.000 | 0.014
0.098 | 0.230
0.000 | 0.034
0.000 | 0.041
0.000 | 0.000
0.760 | 0.860
0.000 | 0.000