 11
11peptides
spectra
0.000 | 0.000
0.082 | 0.102
0.000 | 0.002
0.000 | 0.000
0.104 | 0.126
0.000 | 0.008
0.781 | 0.795
0.000 | 0.000
| Plot | Mito | Lyso | Perox | ER | Golgi | PM | Cytosol | Nucleus | |||||
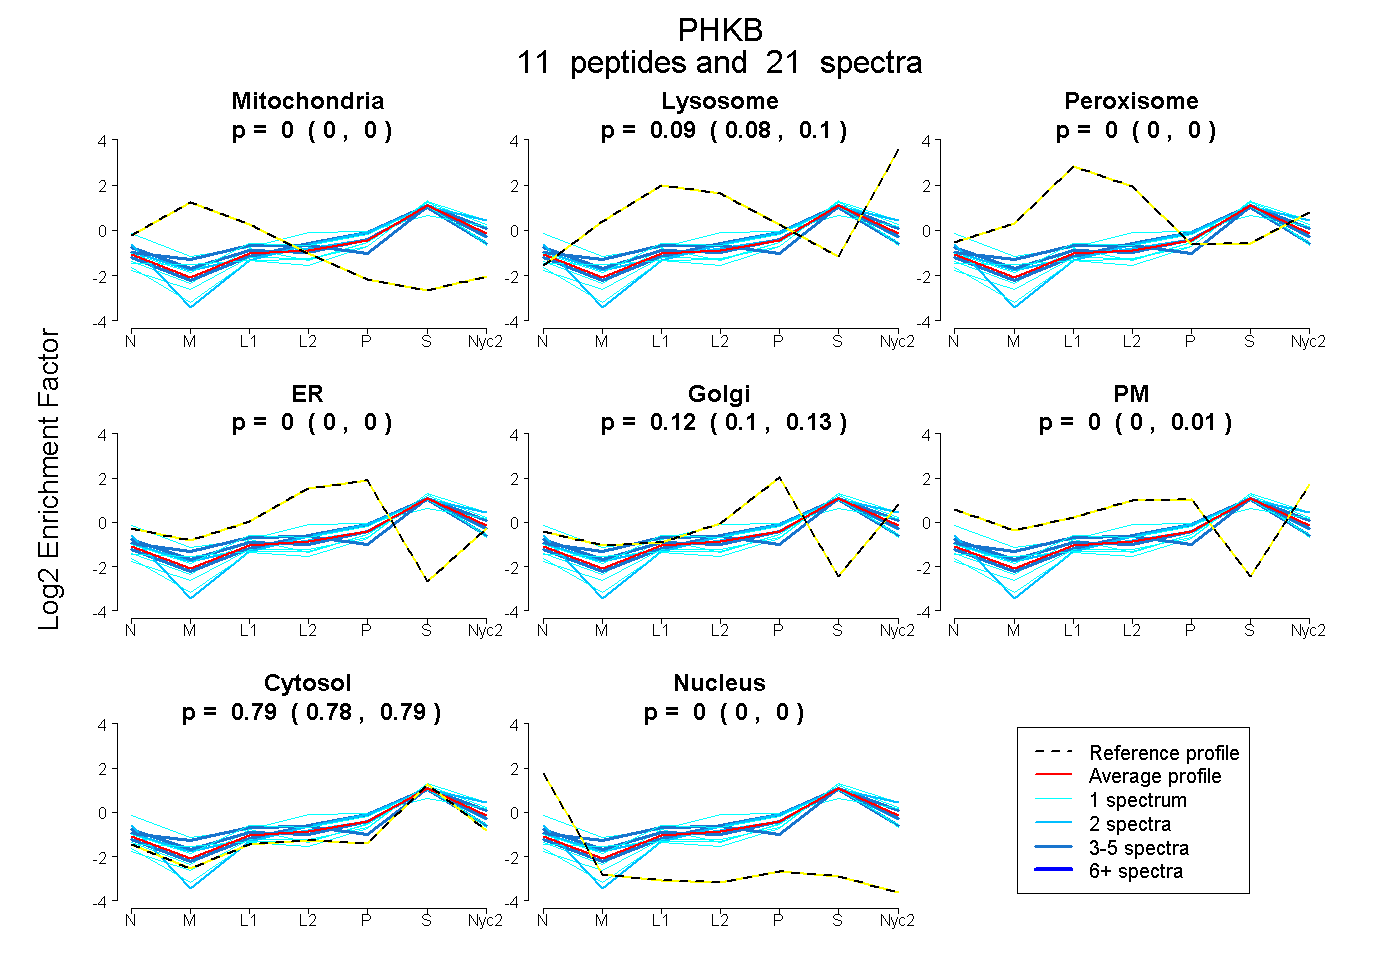
| Expt A |
11 peptides |
21 spectra |
|
0.000 0.000 | 0.000 |
0.094 0.082 | 0.102 |
0.000 0.000 | 0.002 |
0.000 0.000 | 0.000 |
0.118 0.104 | 0.126 |
0.000 0.000 | 0.008 |
0.788 0.781 | 0.795 |
0.000 0.000 | 0.000 |
| 3 spectra, FVPLQNQR | 0.000 | 0.097 | 0.000 | 0.000 | 0.156 | 0.000 | 0.747 | 0.000 | ||
| 1 spectrum, SFEELEFPK | 0.000 | 0.000 | 0.000 | 0.000 | 0.026 | 0.000 | 0.974 | 0.000 | ||
| 5 spectra, GNLEQVK | 0.000 | 0.000 | 0.097 | 0.000 | 0.149 | 0.000 | 0.754 | 0.000 | ||
| 1 spectrum, QVTLGAFGHEEEVISNPLSPR | 0.000 | 0.078 | 0.000 | 0.000 | 0.104 | 0.000 | 0.819 | 0.000 | ||
| 2 spectra, QSSTADAPELR | 0.000 | 0.000 | 0.000 | 0.000 | 0.155 | 0.070 | 0.774 | 0.000 | ||
| 1 spectrum, NPELEFQDK | 0.000 | 0.000 | 0.081 | 0.000 | 0.000 | 0.343 | 0.576 | 0.000 | ||
| 2 spectra, EAFHEFQK | 0.000 | 0.025 | 0.038 | 0.000 | 0.133 | 0.035 | 0.770 | 0.000 | ||
| 1 spectrum, AYFHLGINEK | 0.000 | 0.134 | 0.000 | 0.000 | 0.037 | 0.000 | 0.829 | 0.000 | ||
| 1 spectrum, TPNGIVVAGK | 0.000 | 0.000 | 0.138 | 0.035 | 0.106 | 0.000 | 0.721 | 0.000 | ||
| 3 spectra, THELEHSAIK | 0.032 | 0.055 | 0.155 | 0.000 | 0.000 | 0.020 | 0.738 | 0.000 | ||
| 1 spectrum, QEPDITITEWK | 0.000 | 0.130 | 0.000 | 0.000 | 0.000 | 0.000 | 0.870 | 0.000 |
| Plot | Mito | Lyso or Perox | ER | Golgi | PM | Cytosol | Nucleus | ||||||
| Expt B |
4 peptides |
6 spectra |
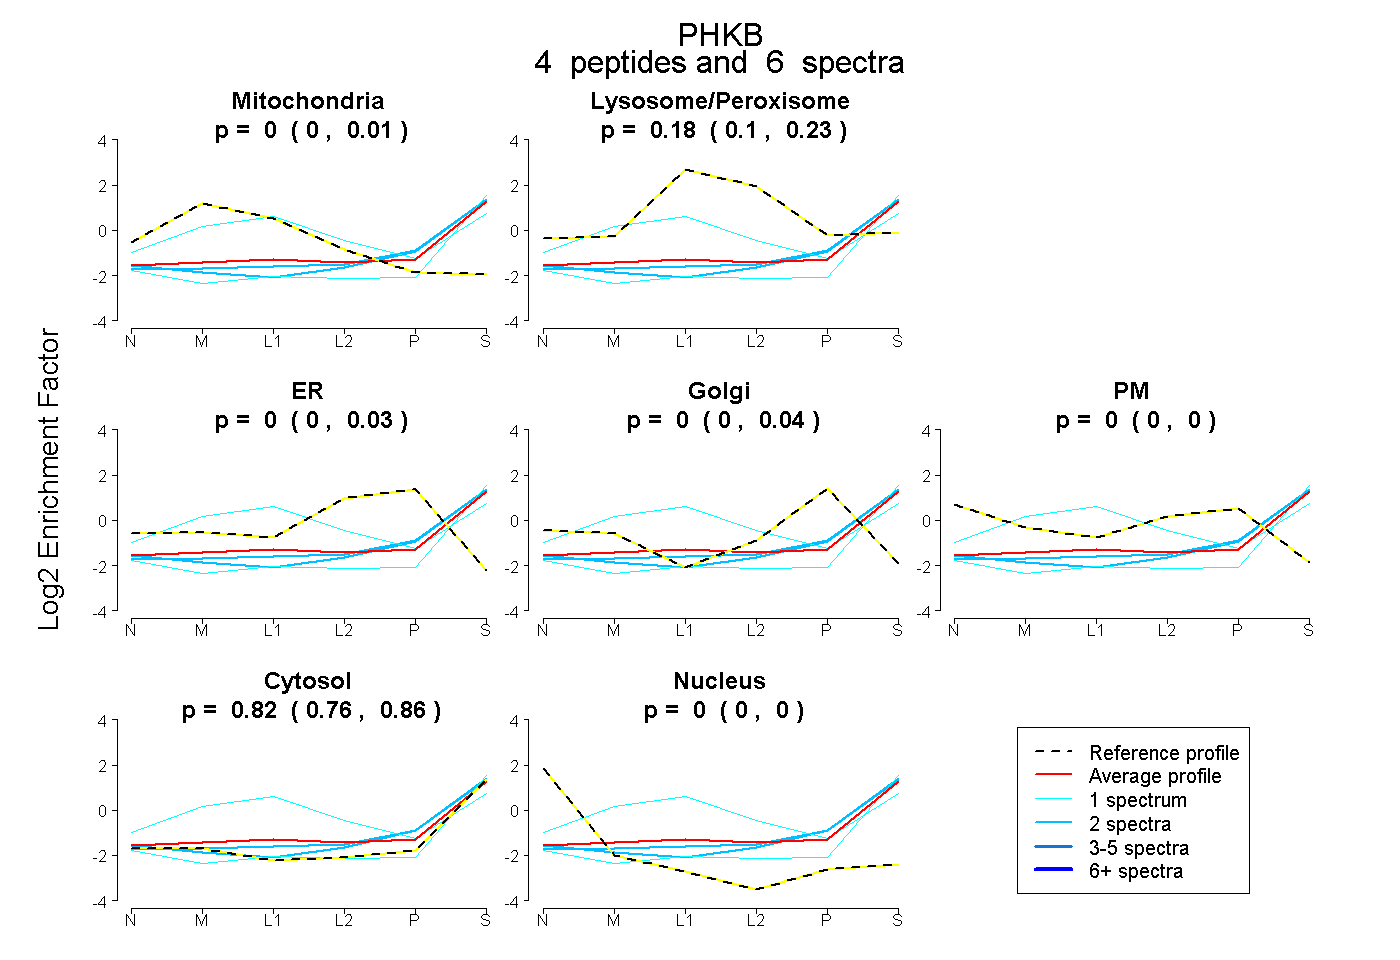 |
0.000 0.000 | 0.014 |
0.179 0.098 | 0.230 |
0.000 0.000 | 0.034 |
0.000 0.000 | 0.041 |
0.000 0.000 | 0.000 |
0.821 0.760 | 0.860 |
0.000 0.000 | 0.000 |
|||
| Plot | Lyso | Other | |||||||||||
| Expt C |
13 peptides |
25 spectra |
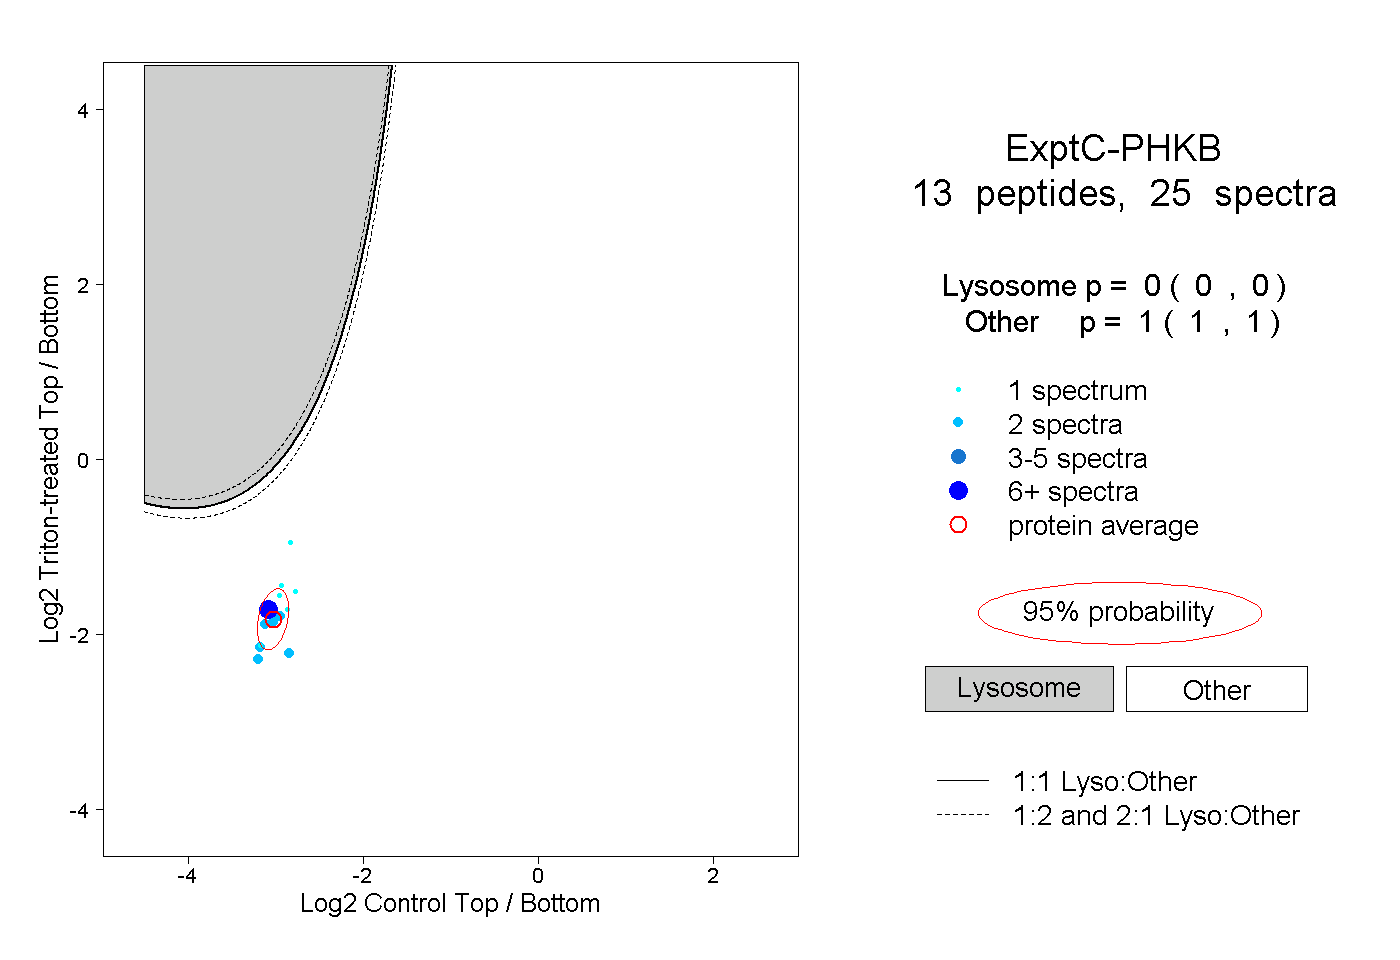 |
0.000 0.000 | 0.000 |
1.000 1.000 | 1.000 |