 5
5peptides
spectra
0.000 | 0.009
0.000 | 0.091
0.000 | 0.046
0.000 | 0.000
0.210 | 0.327
0.108 | 0.218
0.464 | 0.526
0.000 | 0.000
| Plot | Mito | Lyso | Perox | ER | Golgi | PM | Cytosol | Nucleus | |||||
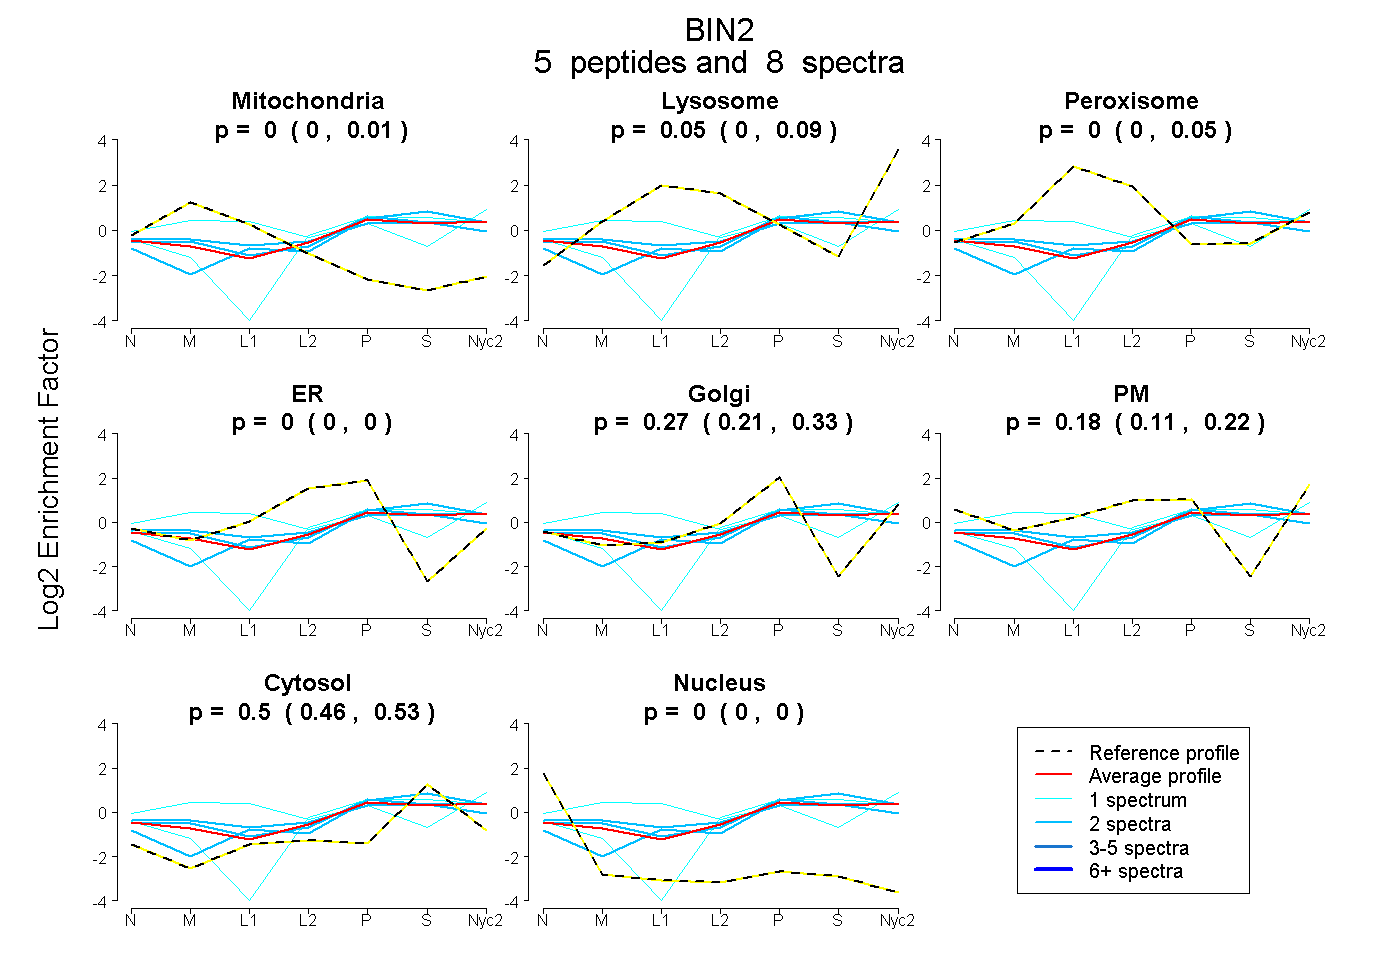
| Expt A |
5 peptides |
8 spectra |
|
0.000 0.000 | 0.009 |
0.054 0.000 | 0.091 |
0.000 0.000 | 0.046 |
0.000 0.000 | 0.000 |
0.266 0.210 | 0.327 |
0.175 0.108 | 0.218 |
0.505 0.464 | 0.526 |
0.000 0.000 | 0.000 |
| 1 spectrum, FEQSASNFYQQQAEGHR | 0.191 | 0.224 | 0.052 | 0.000 | 0.086 | 0.268 | 0.179 | 0.000 | ||
| 1 spectrum, AIVGNNDLLWEDYEEK | 0.000 | 0.000 | 0.000 | 0.000 | 0.431 | 0.000 | 0.569 | 0.000 | ||
| 2 spectra, GLSSSSR | 0.000 | 0.097 | 0.000 | 0.000 | 0.278 | 0.000 | 0.624 | 0.000 | ||
| 2 spectra, AEEDFSK | 0.025 | 0.005 | 0.087 | 0.000 | 0.411 | 0.000 | 0.471 | 0.000 | ||
| 2 spectra, LADQALR | 0.026 | 0.084 | 0.059 | 0.000 | 0.156 | 0.202 | 0.473 | 0.000 |
| Plot | Lyso | Other | |||||||||||
| Expt C |
2 peptides |
3 spectra |
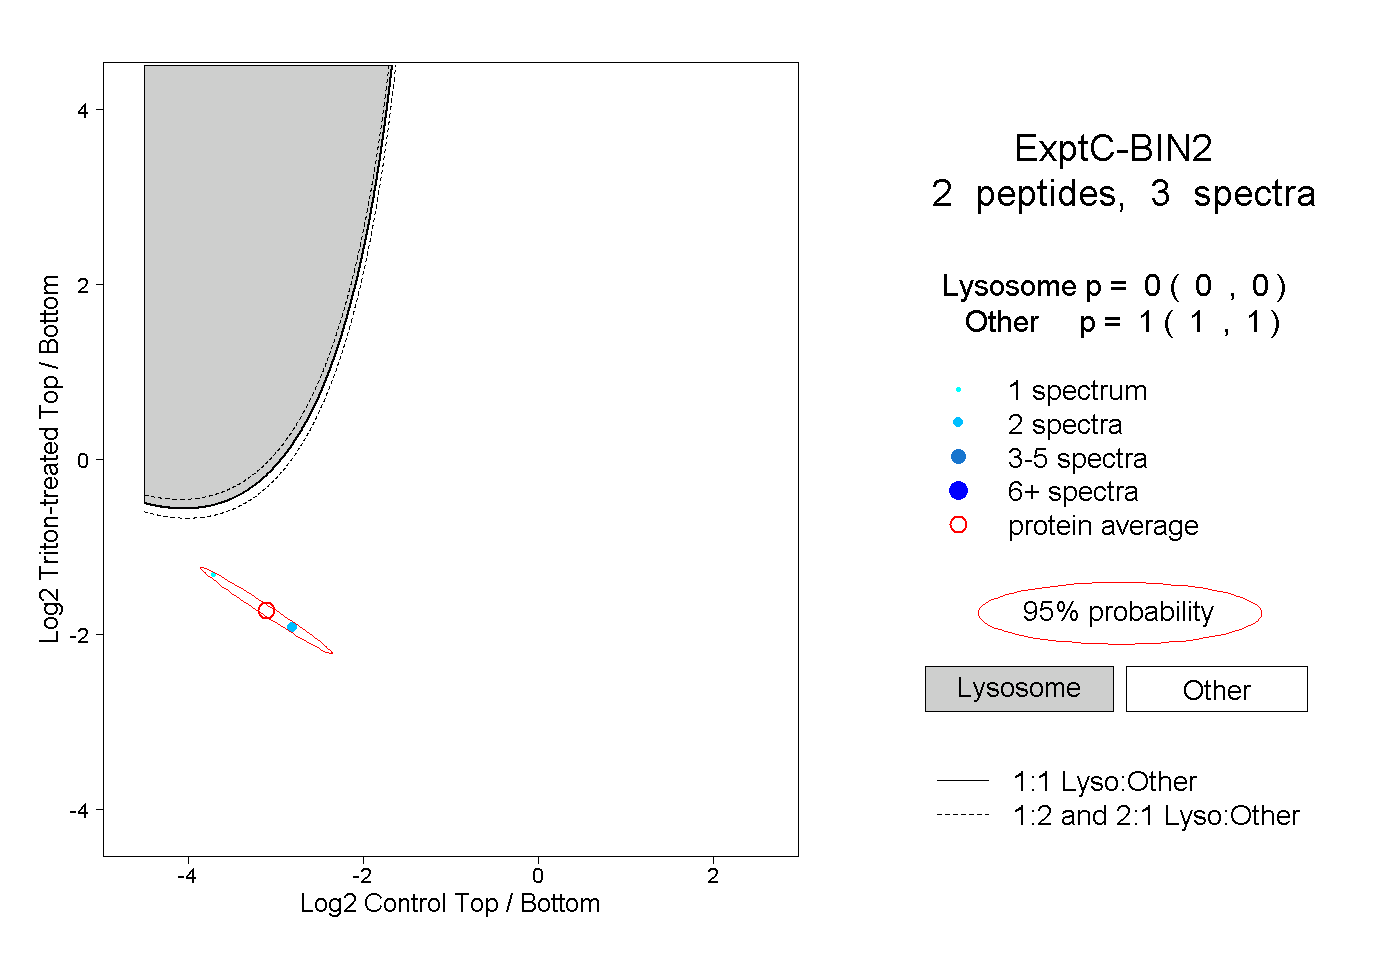 |
0.000 0.000 | 0.000 |
1.000 1.000 | 1.000 |