 3
3peptides
spectra
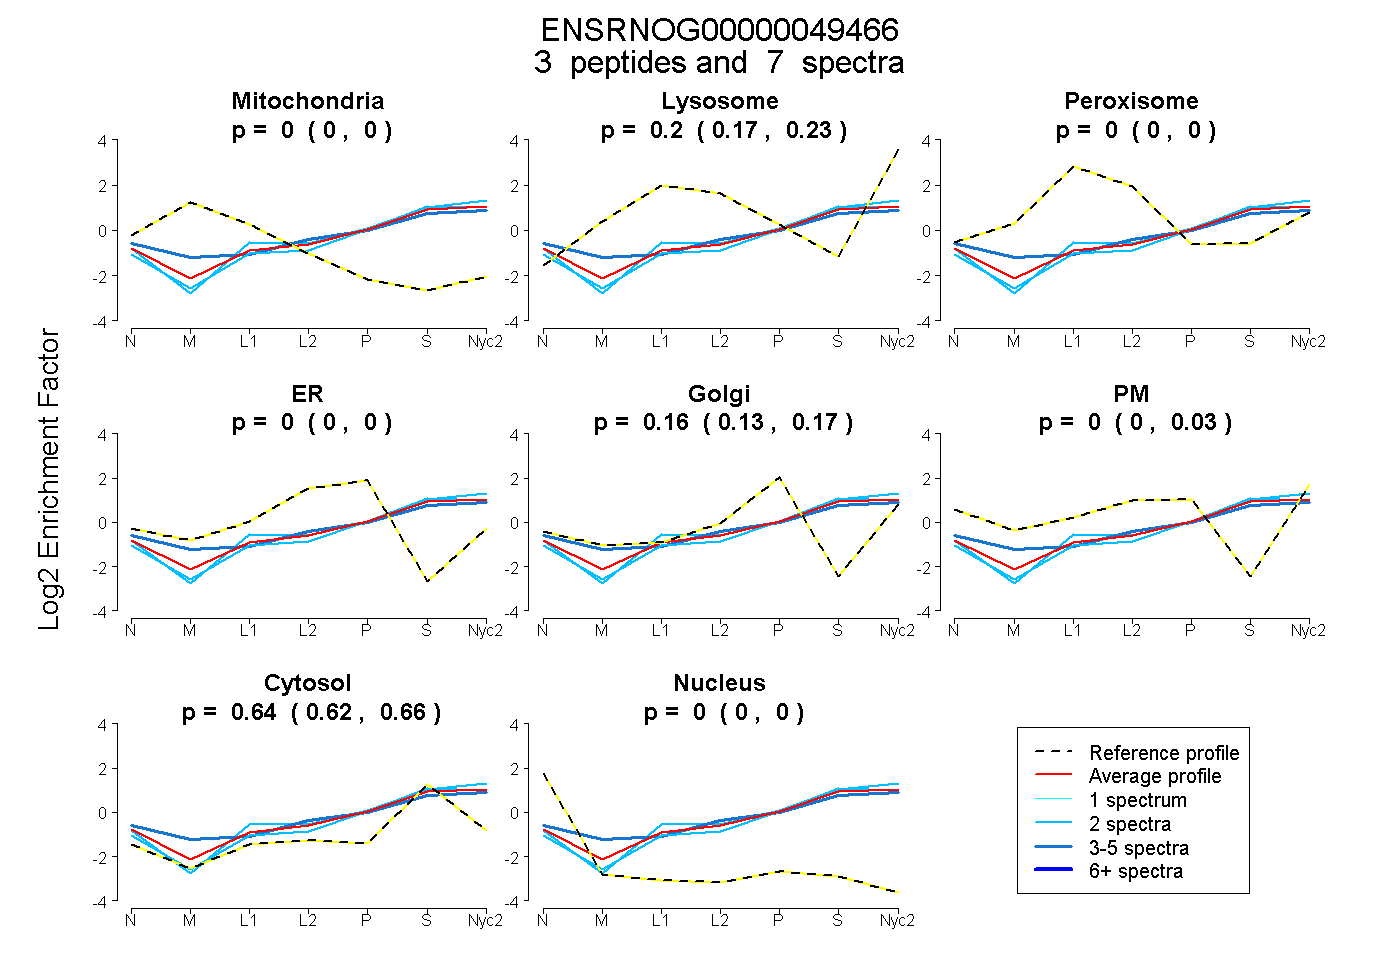
0.000 | 0.000
0.172 | 0.227
0.000 | 0.000
0.000 | 0.000
0.126 | 0.171
0.000 | 0.027
0.619 | 0.661
0.000 | 0.000
1peptide
spectra
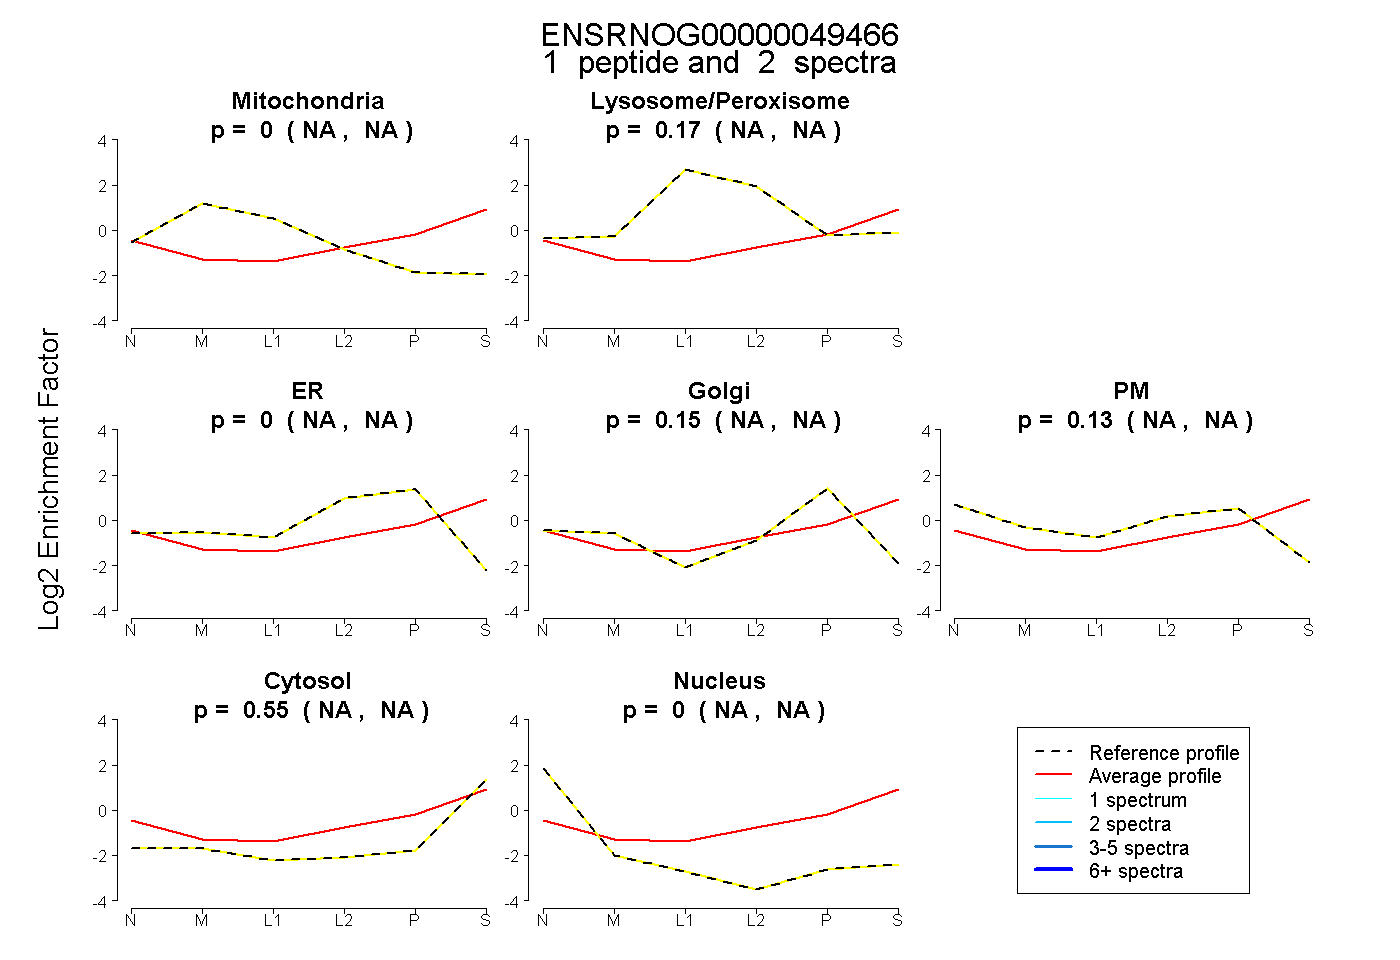
NA | NA
NA | NA
NA | NA
NA | NA
NA | NA
NA | NA
NA | NA
3peptides
spectra
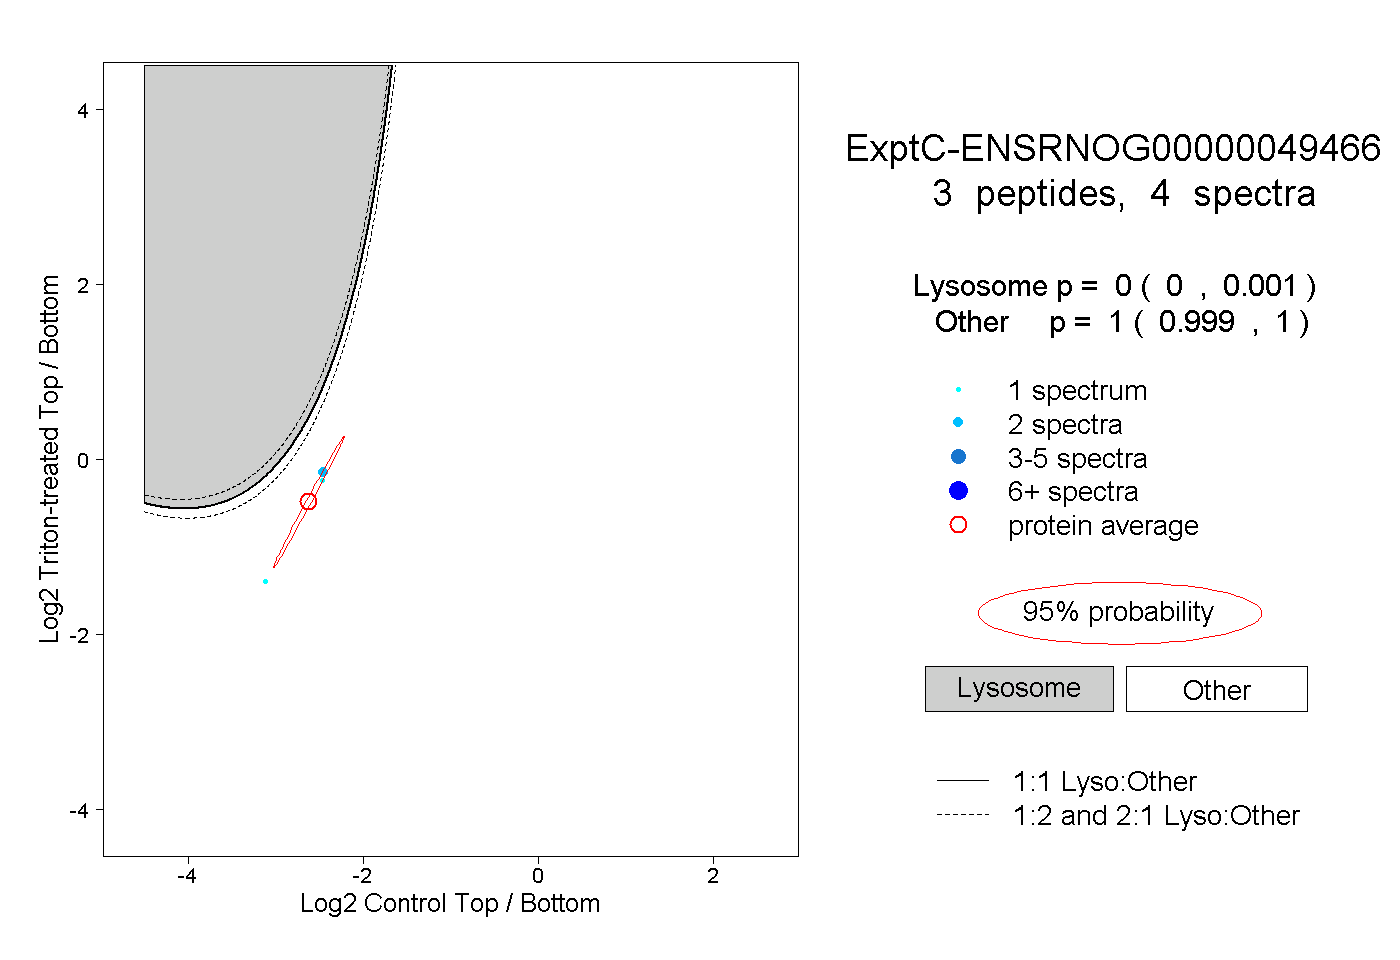
0.000 | 0.001
0.999 | 1.000
1peptide
spectrum
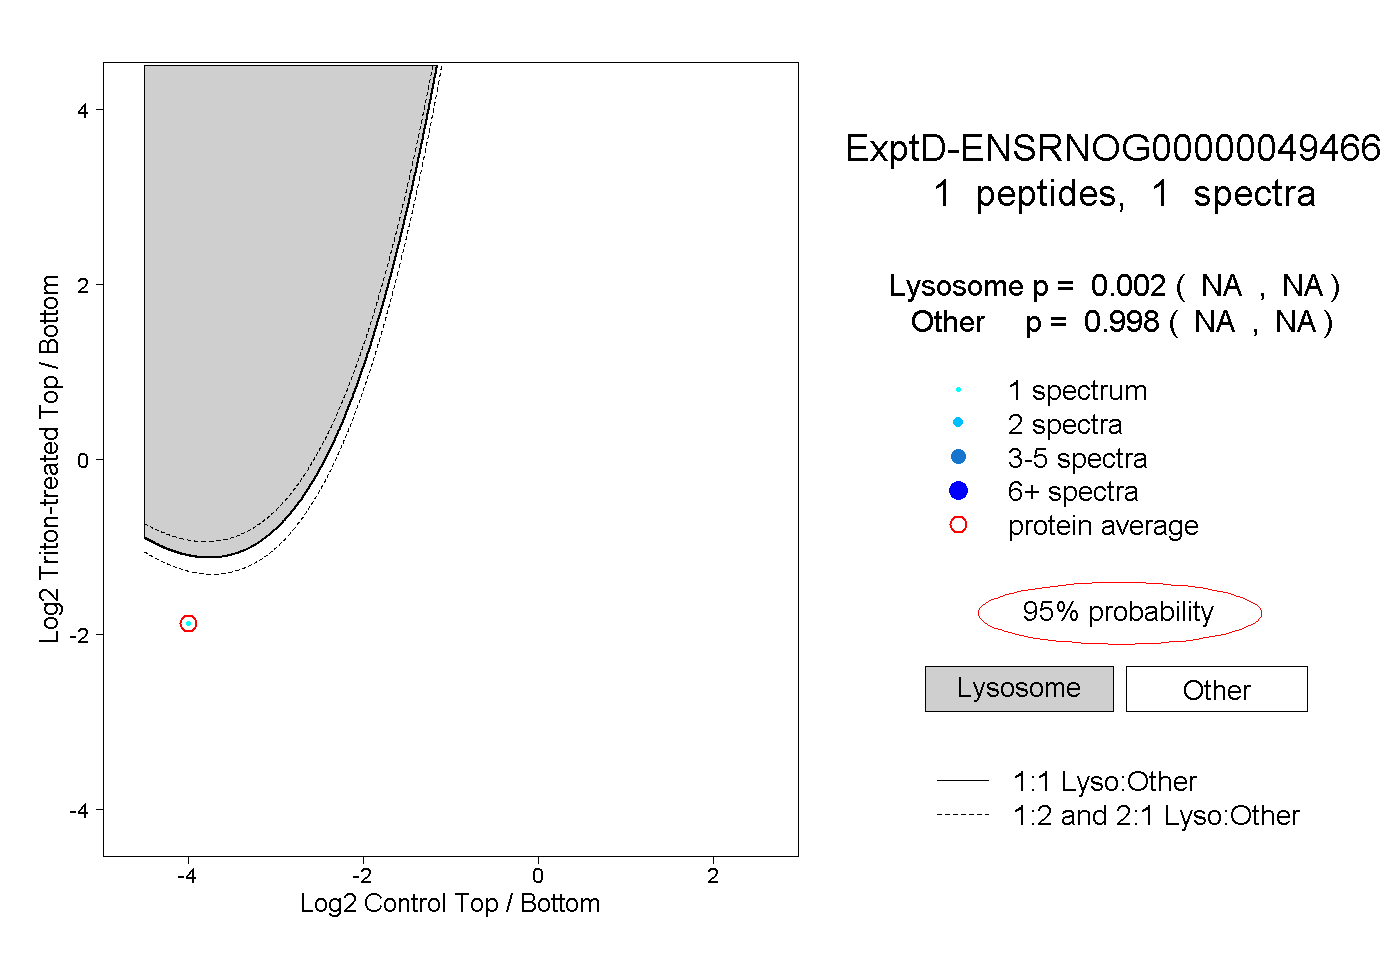
NA | NA
NA | NA