 3
3peptides
spectra
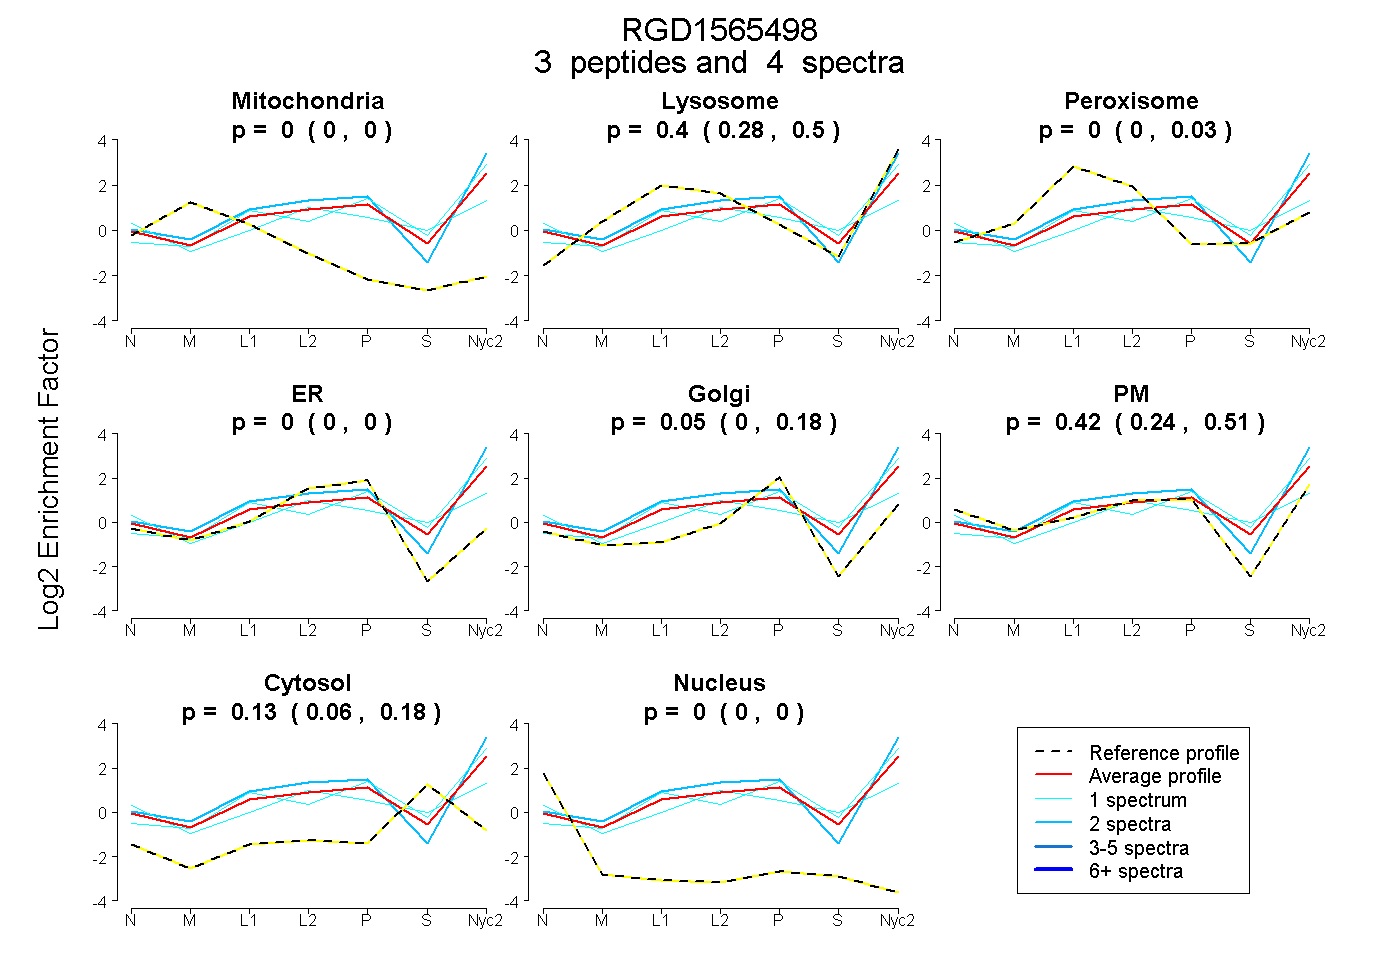
0.000 | 0.000
0.278 | 0.498
0.000 | 0.027
0.000 | 0.000
0.000 | 0.181
0.237 | 0.512
0.063 | 0.183
0.000 | 0.000
| Plot | Mito | Lyso | Perox | ER | Golgi | PM | Cytosol | Nucleus | |||||
| Expt A |
3 peptides |
4 spectra |
|
0.000 0.000 | 0.000 |
0.404 0.278 | 0.498 |
0.000 0.000 | 0.027 |
0.000 0.000 | 0.000 |
0.047 0.000 | 0.181 |
0.415 0.237 | 0.512 |
0.134 0.063 | 0.183 |
0.000 0.000 | 0.000 |
| 2 spectra, ISSFLR | 0.000 | 0.471 | 0.000 | 0.000 | 0.000 | 0.529 | 0.000 | 0.000 | ||
| 1 spectrum, VVHFYDDK | 0.000 | 0.594 | 0.000 | 0.000 | 0.283 | 0.000 | 0.123 | 0.000 | ||
| 1 spectrum, QTTASEMK | 0.000 | 0.091 | 0.120 | 0.000 | 0.000 | 0.498 | 0.291 | 0.000 |
| Plot | Lyso | Other | |||||||||||
| Expt C |
2 peptides |
4 spectra |
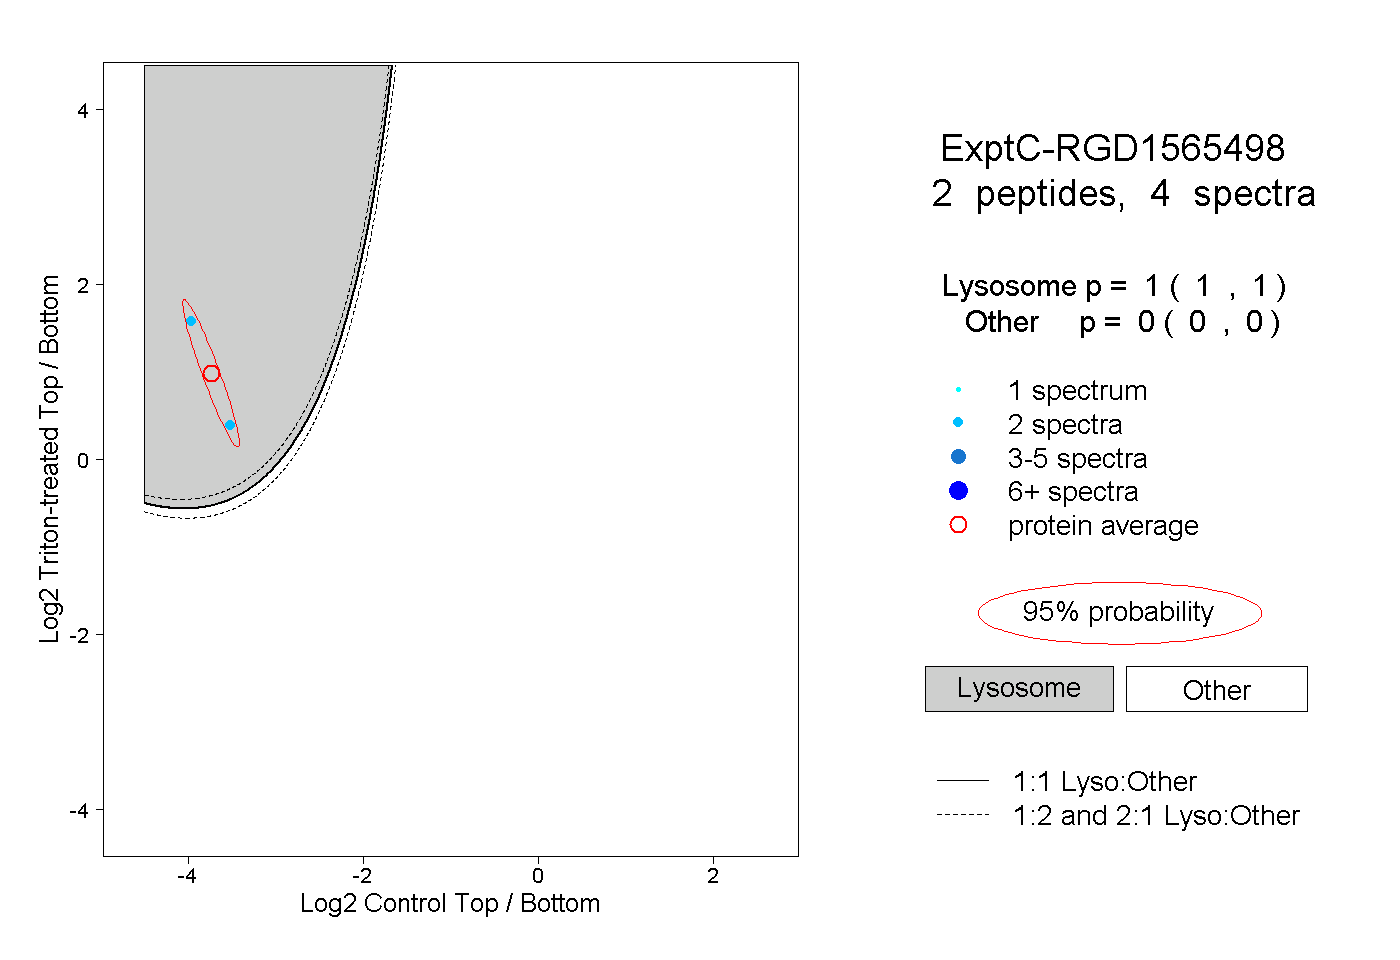 |
1.000 1.000 | 1.000 |
0.000 0.000 | 0.000 |