 2
2peptides
spectra
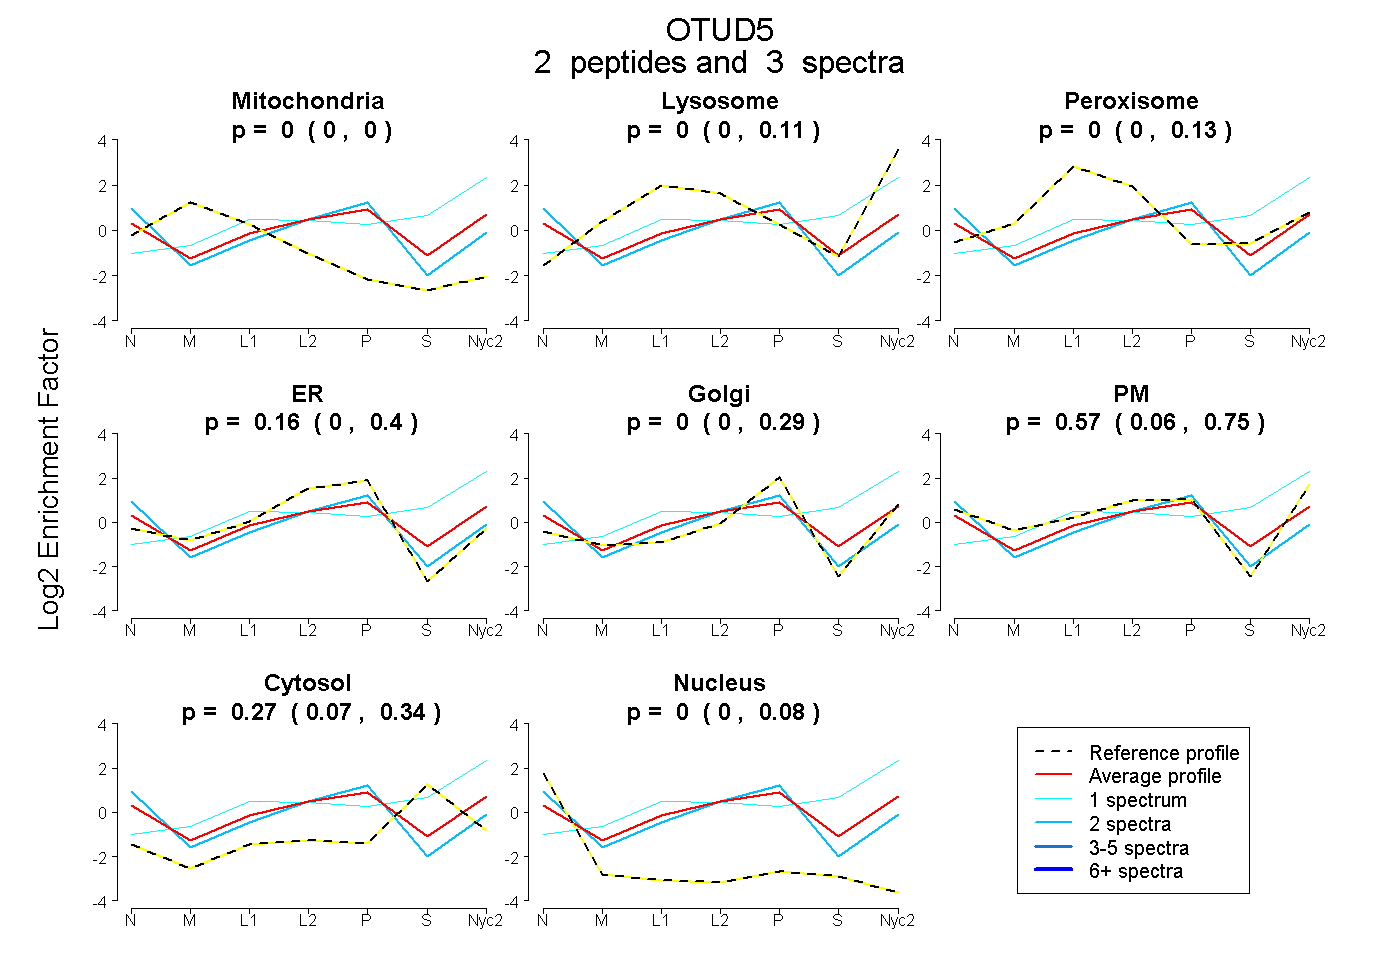
0.000 | 0.000
0.000 | 0.113
0.000 | 0.128
0.000 | 0.398
0.000 | 0.287
0.063 | 0.745
0.066 | 0.339
0.000 | 0.078
2peptides
spectra
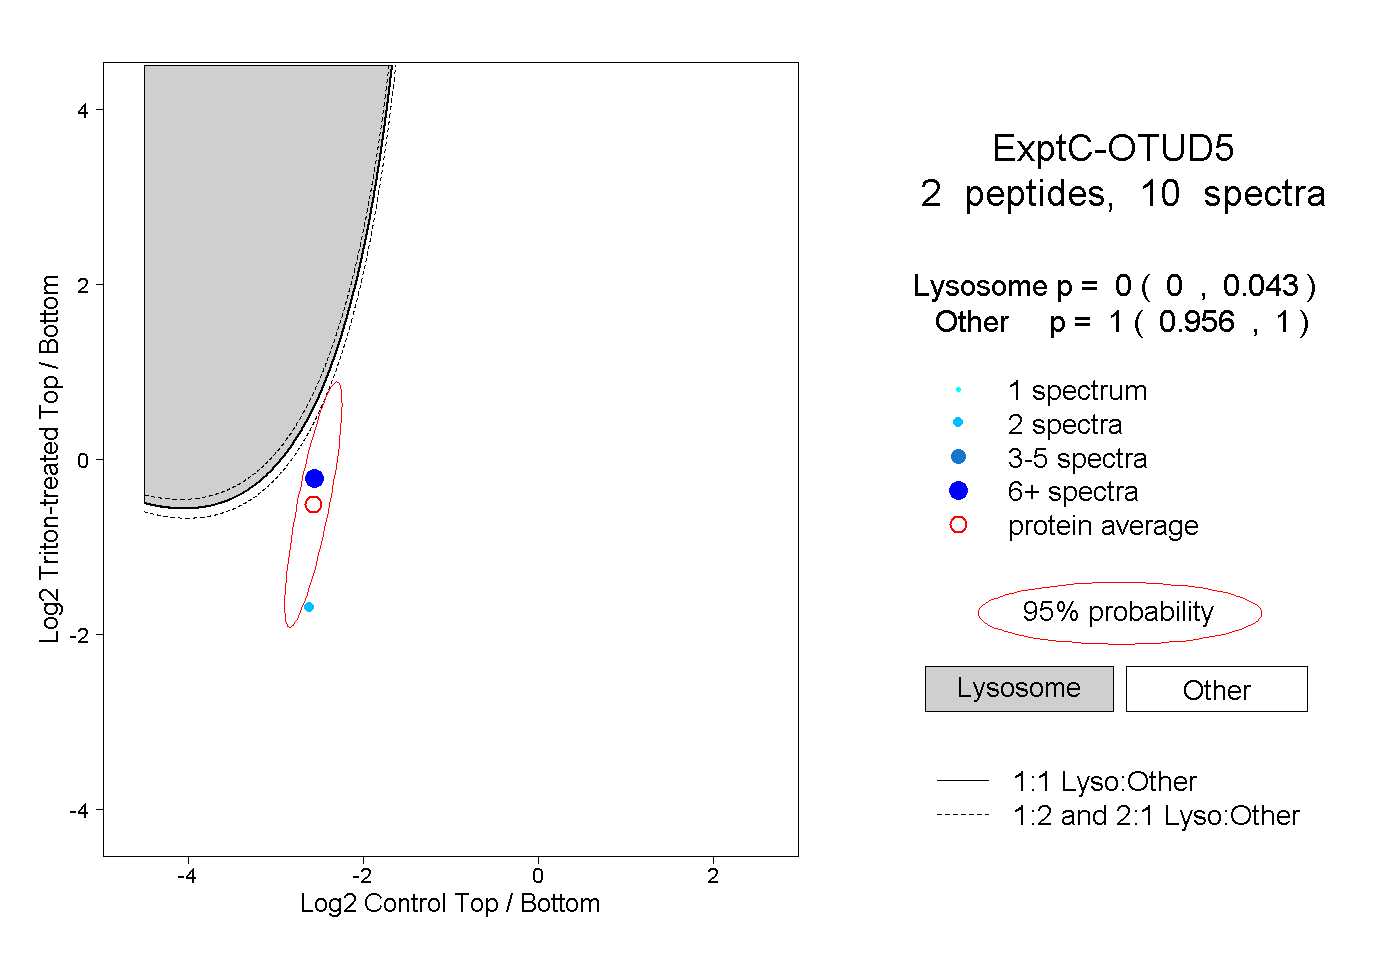
0.000 | 0.043
0.956 | 1.000
1peptide
spectrum
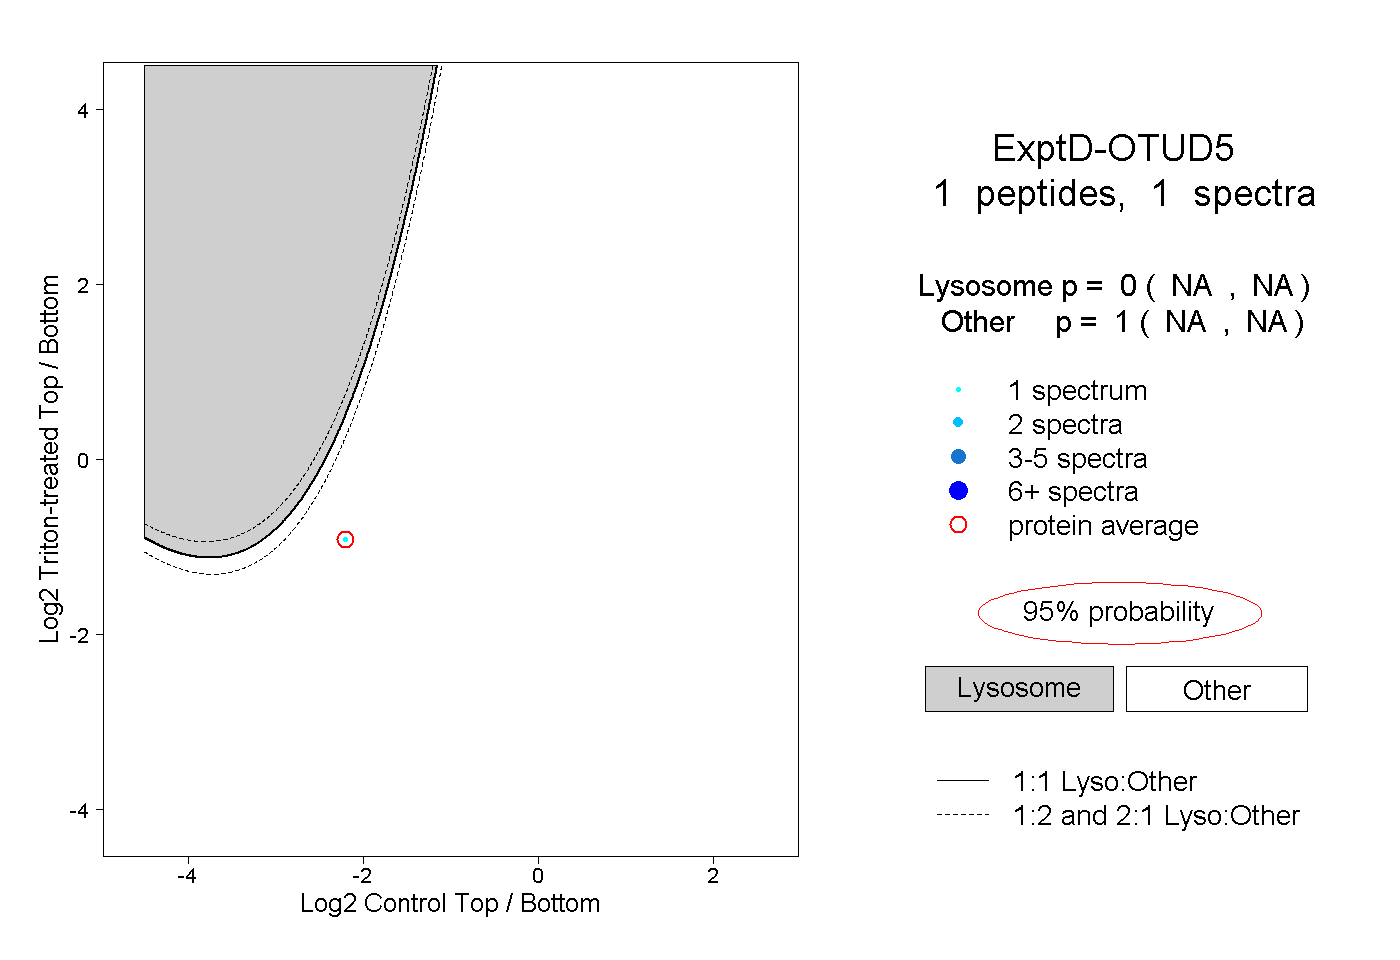
NA | NA
NA | NA