 3
3peptides
spectra
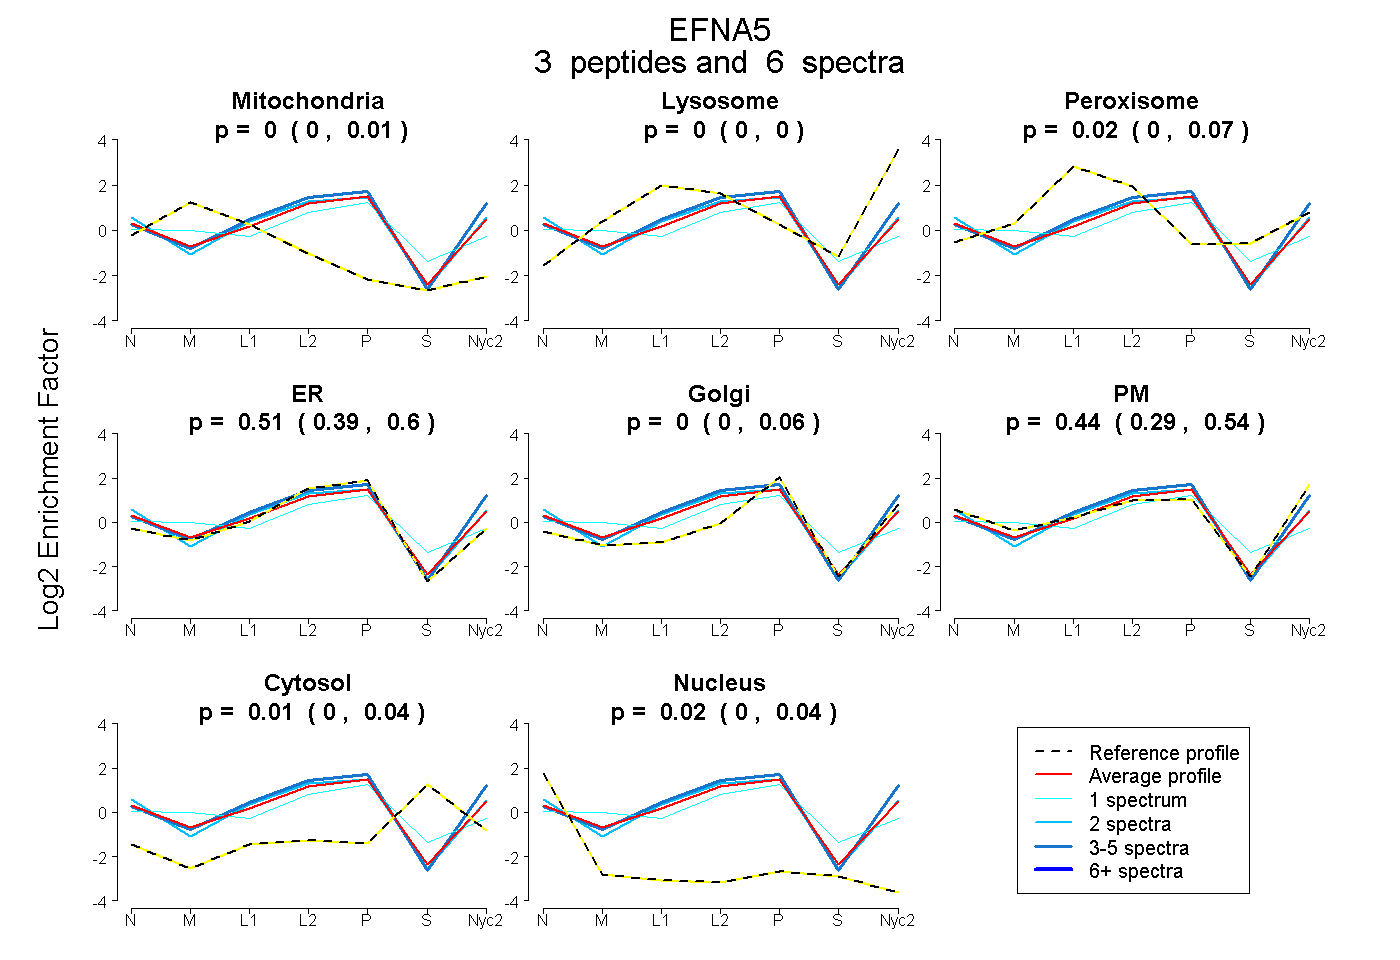
0.000 | 0.008
0.000 | 0.000
0.000 | 0.068
0.390 | 0.601
0.000 | 0.056
0.293 | 0.535
0.000 | 0.044
0.000 | 0.037
1peptide
spectrum
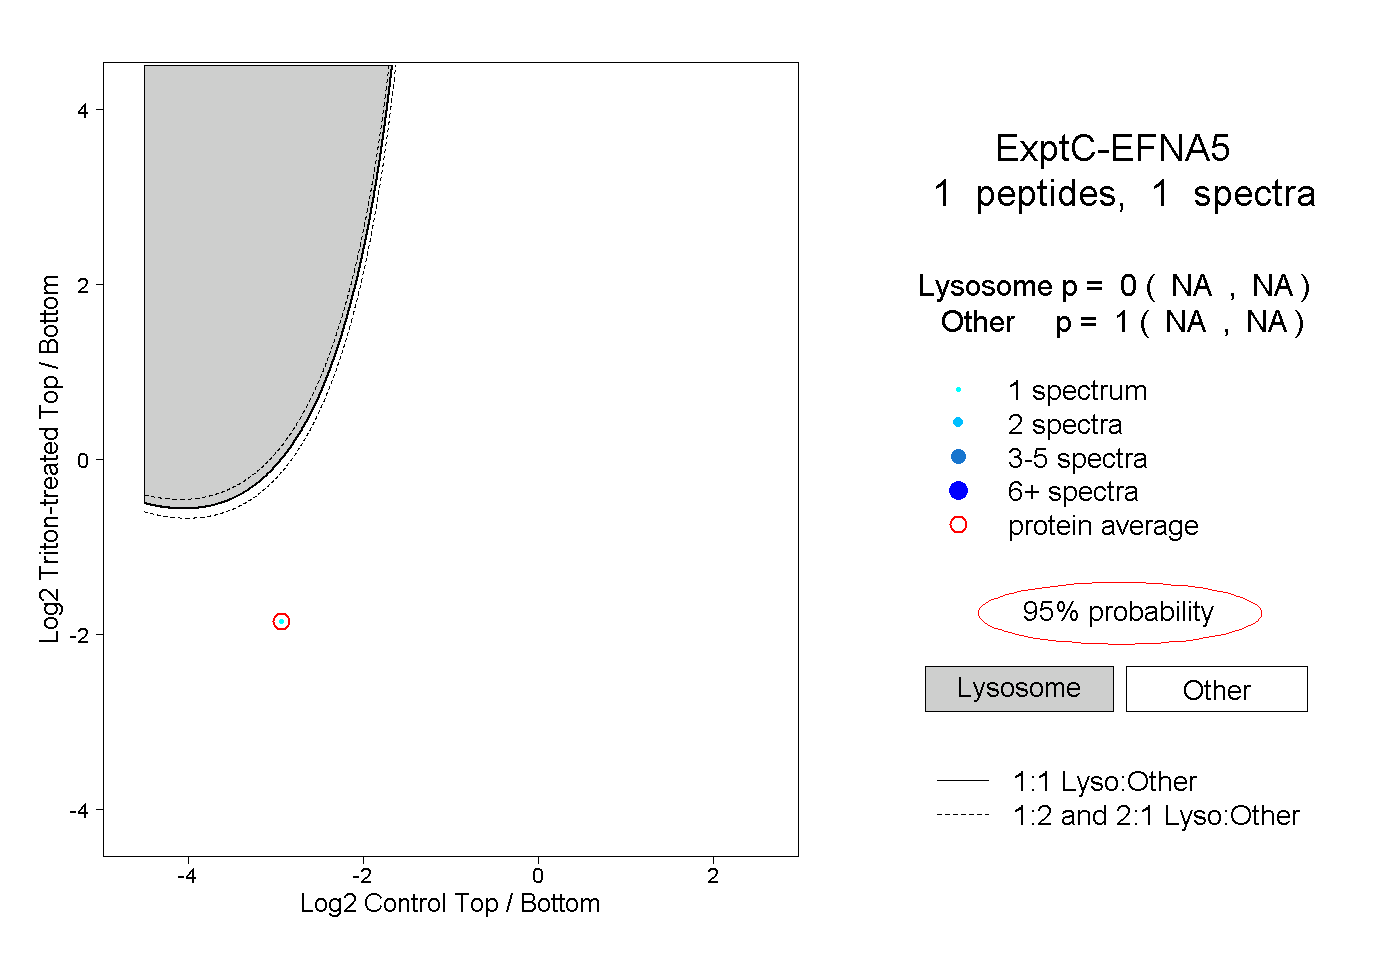
NA | NA
NA | NA
| Plot | Mito | Lyso | Perox | ER | Golgi | PM | Cytosol | Nucleus | |||||
| Expt A |
3 peptides |
6 spectra |
|
0.000 0.000 | 0.008 |
0.000 0.000 | 0.000 |
0.023 0.000 | 0.068 |
0.514 0.390 | 0.601 |
0.000 0.000 | 0.056 |
0.438 0.293 | 0.535 |
0.005 0.000 | 0.044 |
0.020 0.000 | 0.037 |
||
| Plot | Lyso | Other | |||||||||||
| Expt C |
1 peptide |
1 spectrum |
|
0.000 NA | NA |
1.000 NA | NA |