 4
4peptides
spectra
0.178 | 0.400
0.000 | 0.000
0.000 | 0.000
0.000 | 0.384
0.000 | 0.521
0.000 | 0.270
0.017 | 0.216
0.006 | 0.184
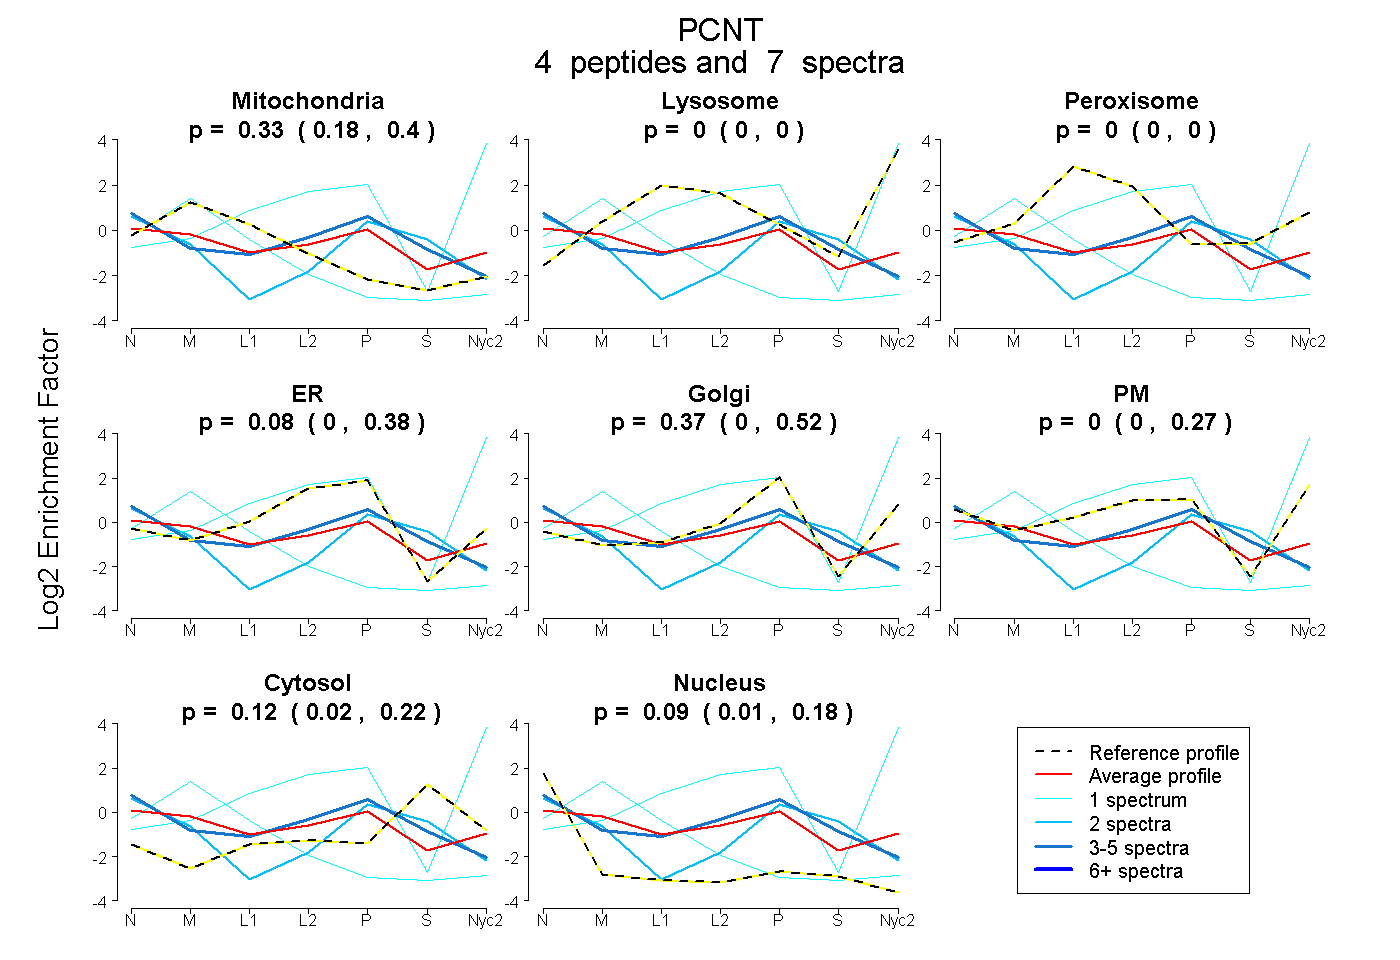
| Plot | Mito | Lyso | Perox | ER | Golgi | PM | Cytosol | Nucleus | |||||
| Expt A |
4 peptides |
7 spectra |
|
0.333 0.178 | 0.400 |
0.000 0.000 | 0.000 |
0.000 0.000 | 0.000 |
0.082 0.000 | 0.384 |
0.372 0.000 | 0.521 |
0.004 0.000 | 0.270 |
0.121 0.017 | 0.216 |
0.087 0.006 | 0.184 |
| 2 spectra, LLDLFGETLK | 0.000 | 0.000 | 0.000 | 0.000 | 0.337 | 0.000 | 0.290 | 0.373 | ||
| 1 spectrum, LSIIDR | 0.000 | 0.546 | 0.000 | 0.000 | 0.138 | 0.315 | 0.000 | 0.000 | ||
| 1 spectrum, ALELEAMLEK | 0.865 | 0.000 | 0.000 | 0.000 | 0.000 | 0.000 | 0.000 | 0.135 | ||
| 3 spectra, VLESELEDQLVQHR | 0.069 | 0.000 | 0.000 | 0.487 | 0.000 | 0.000 | 0.227 | 0.218 |
| Plot | Mito | Lyso or Perox | ER | Golgi | PM | Cytosol | Nucleus | ||||||
| Expt B |
1 peptide |
1 spectrum |
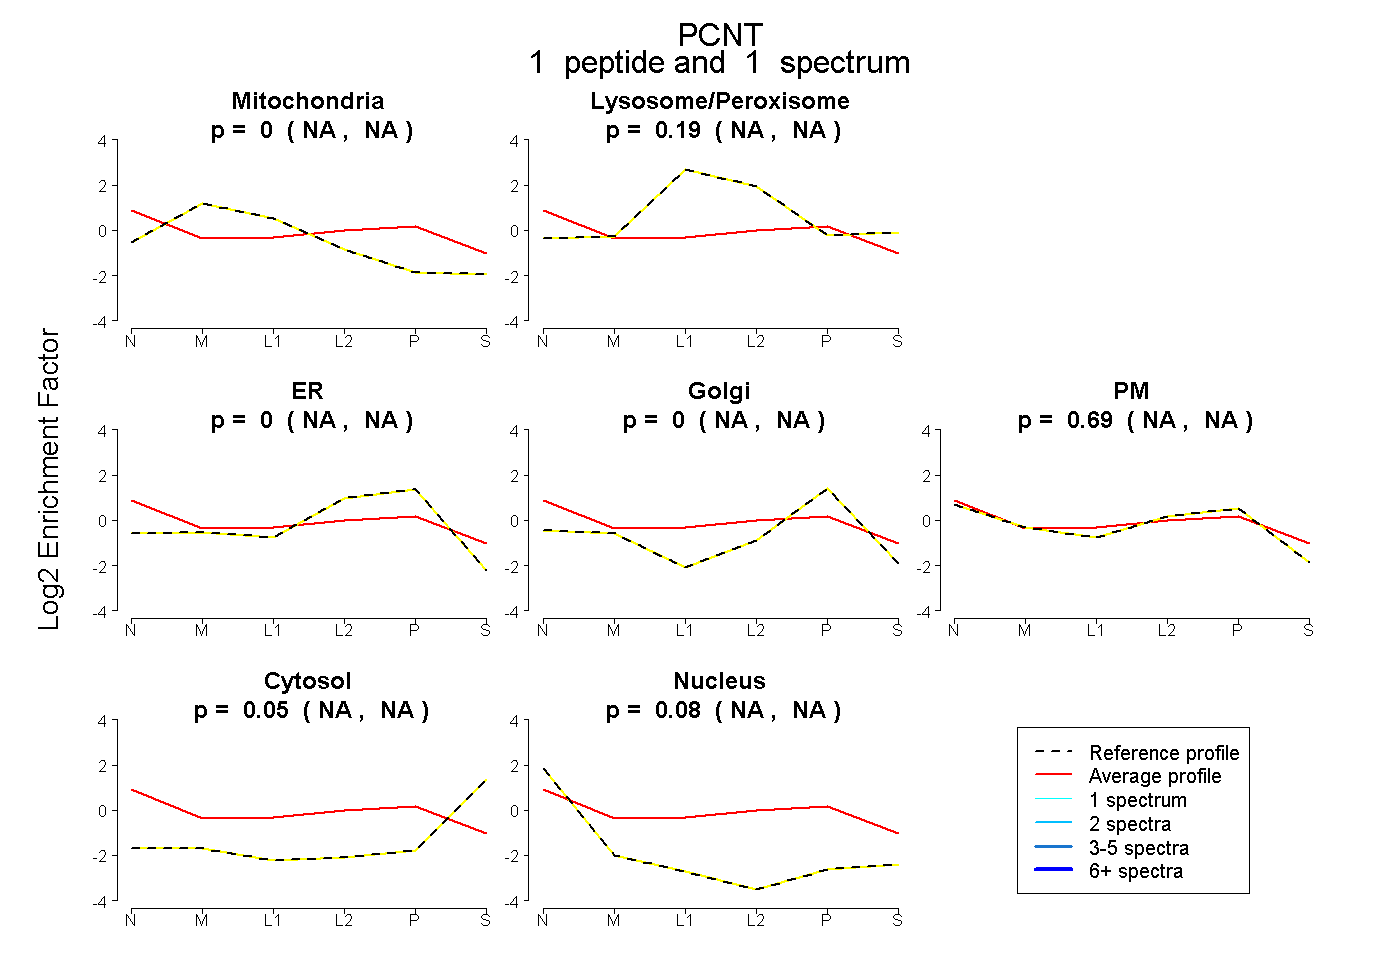 |
0.000 NA | NA |
0.187 NA | NA |
0.000 NA | NA |
0.000 NA | NA |
0.689 NA | NA |
0.047 NA | NA |
0.076 NA | NA |
|||
| Plot | Lyso | Other | |||||||||||
| Expt C |
3 peptides |
3 spectra |
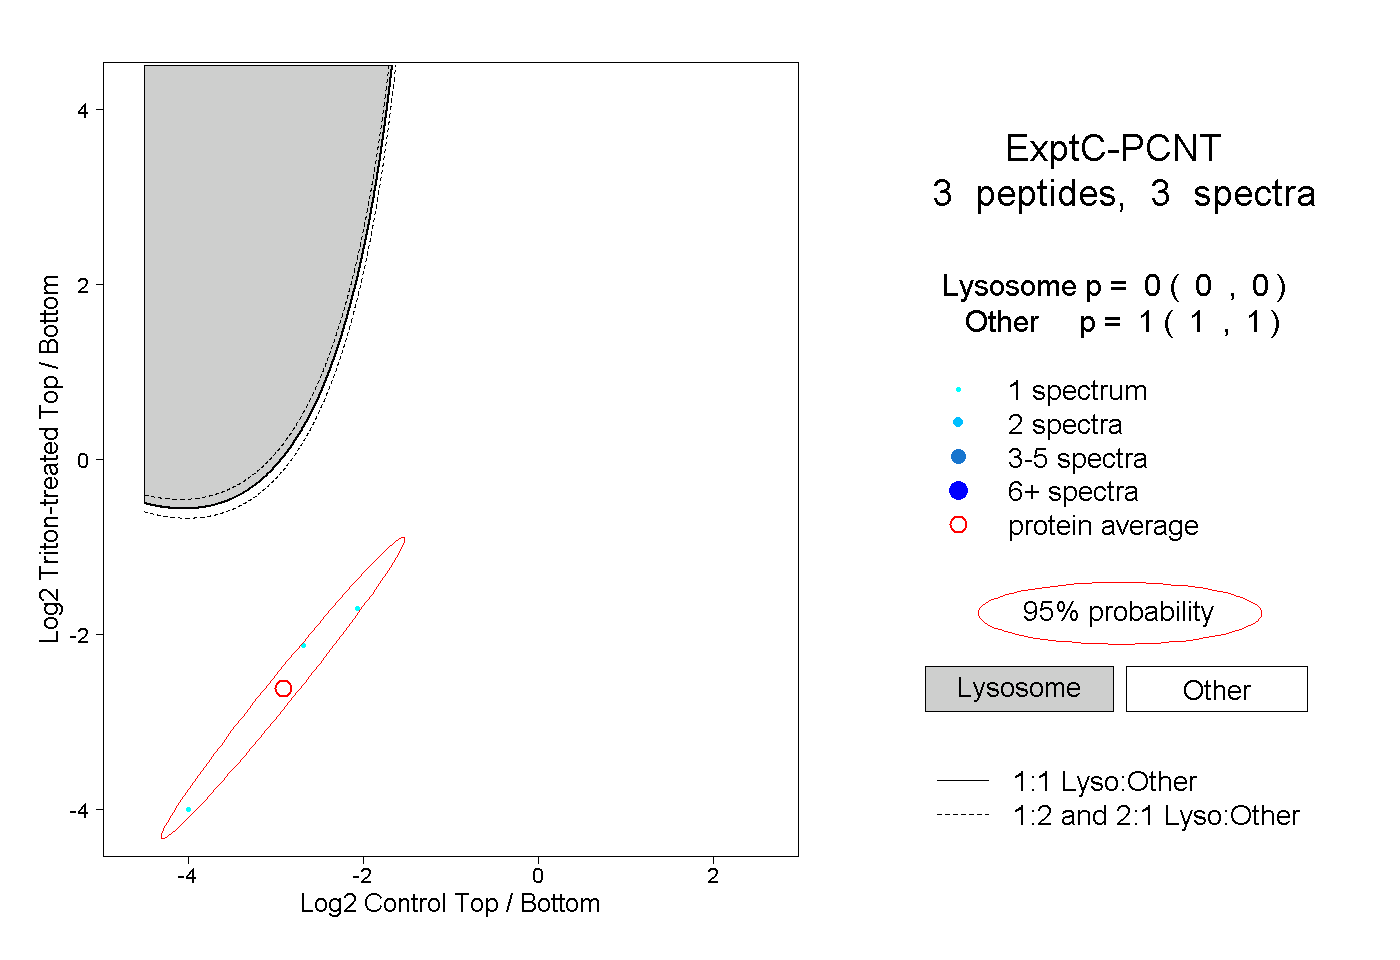 |
0.000 0.000 | 0.000 |
1.000 1.000 | 1.000 |