 1
1peptide
spectra
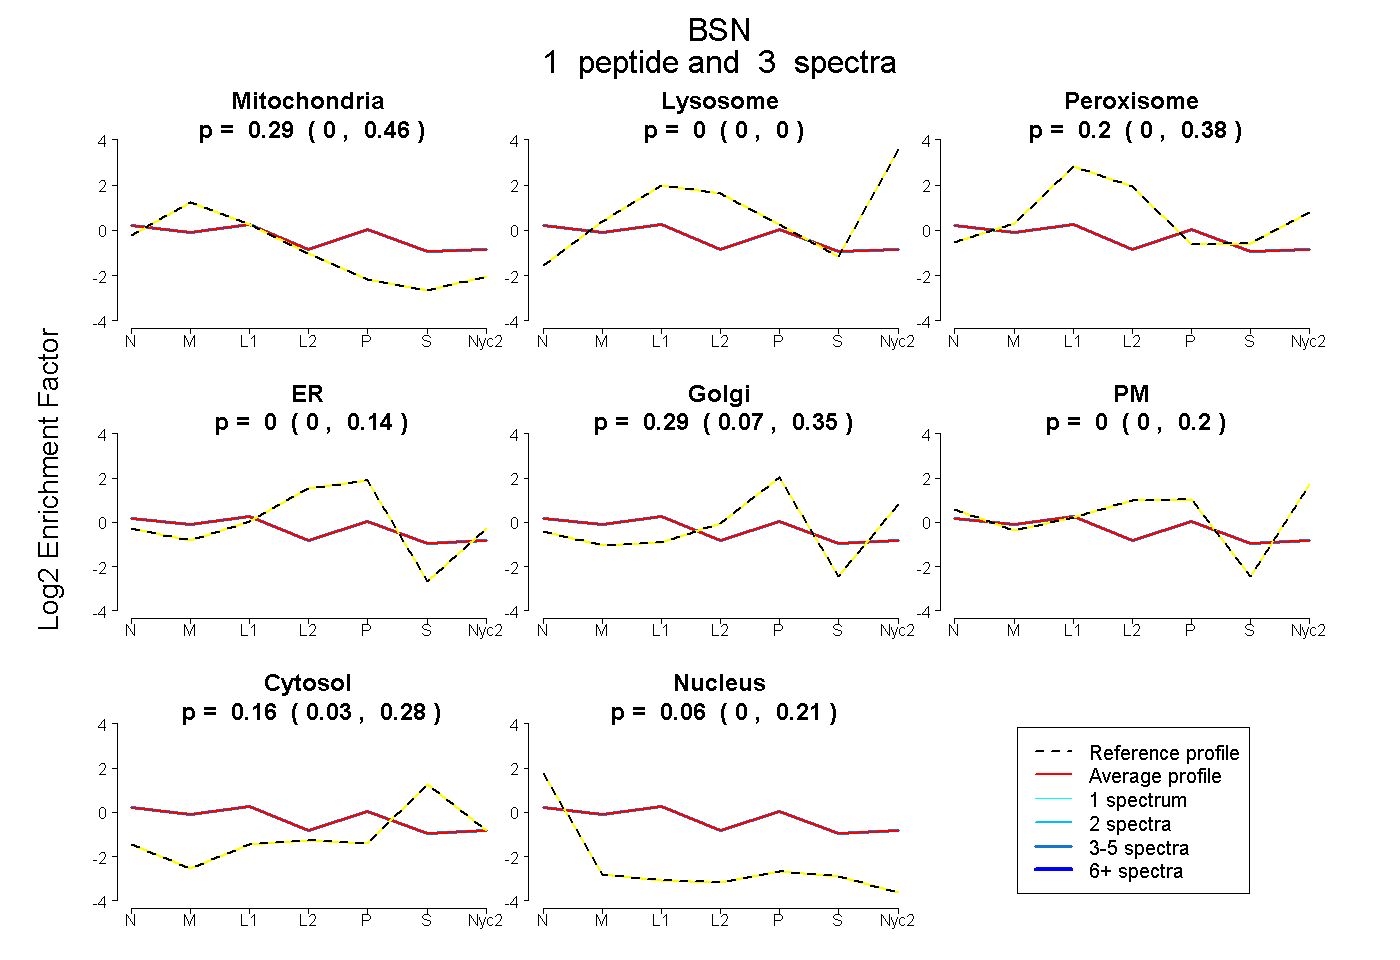
0.000 | 0.464
0.000 | 0.000
0.000 | 0.380
0.000 | 0.137
0.069 | 0.345
0.000 | 0.196
0.026 | 0.284
0.000 | 0.212
1peptide
spectra
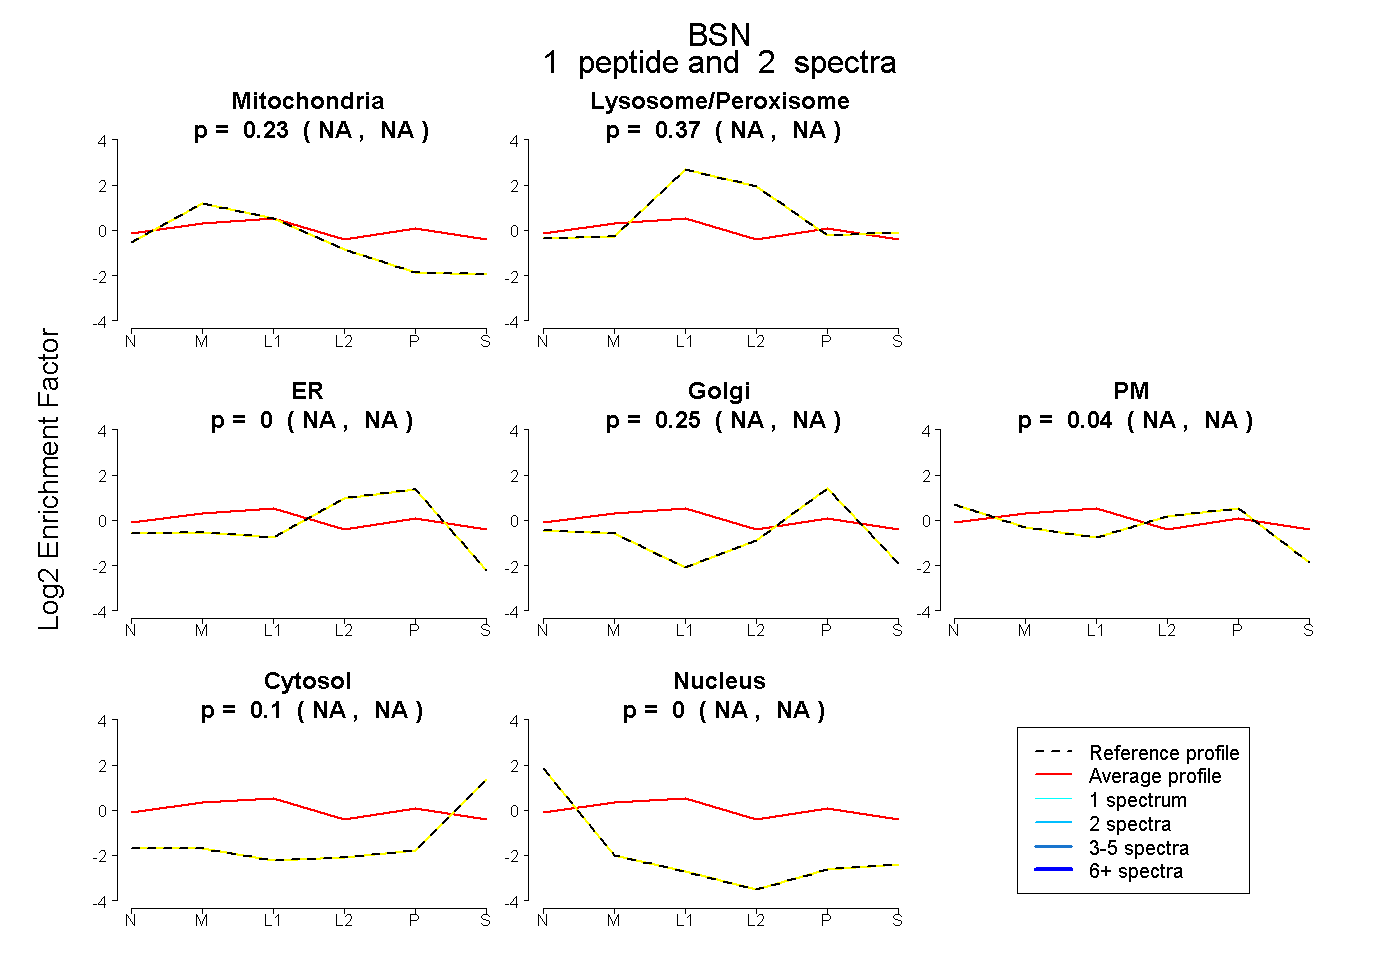
NA | NA
NA | NA
NA | NA
NA | NA
NA | NA
NA | NA
NA | NA
2peptides
spectra
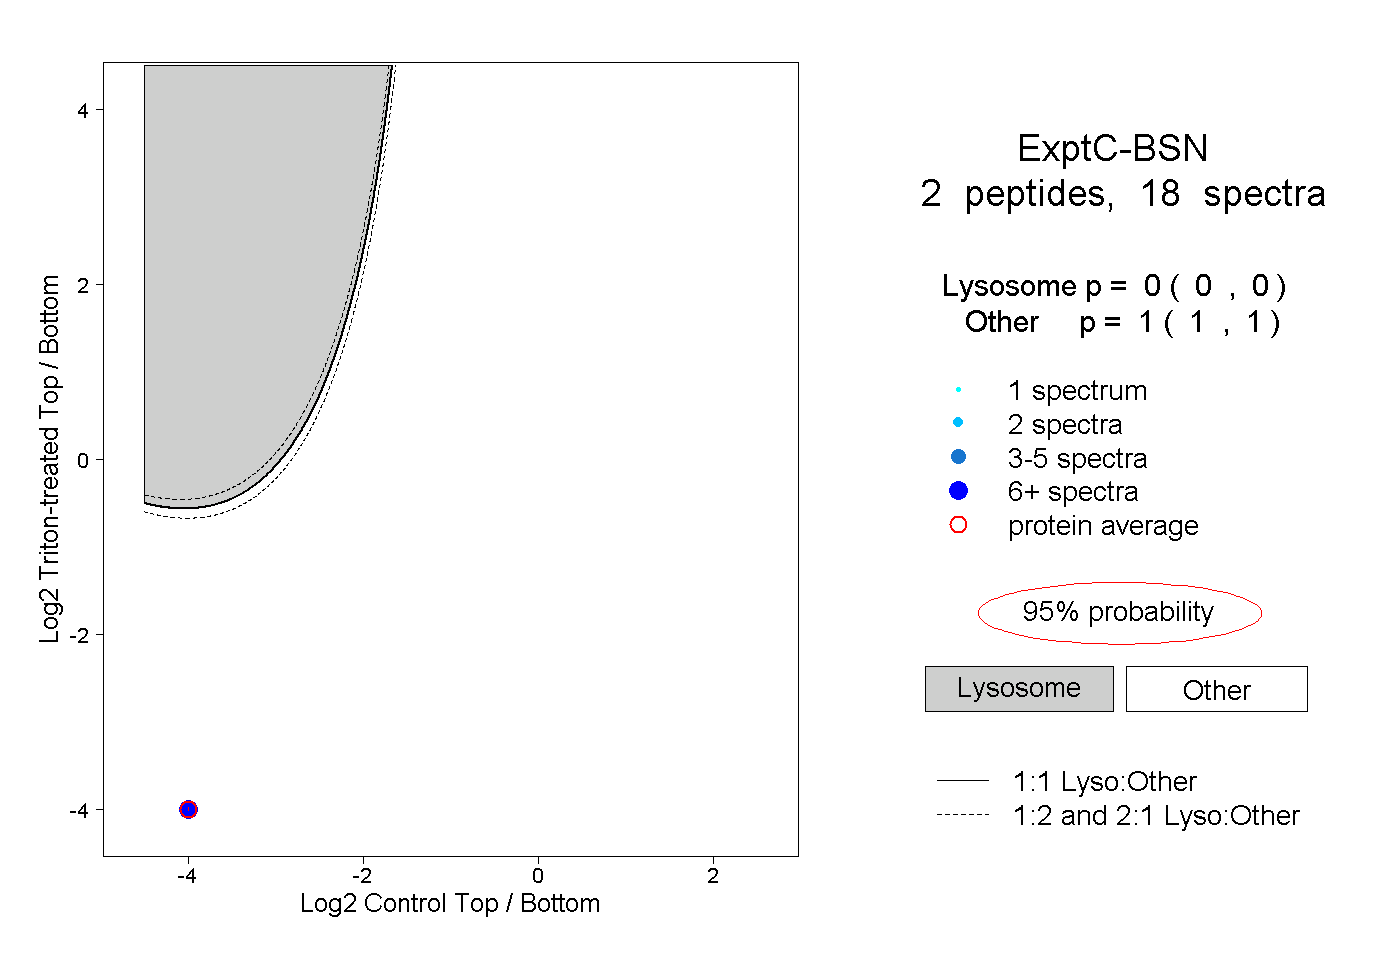
0.000 | 0.000
1.000 | 1.000