 6
6peptides
spectra
0.000 | 0.039
0.000 | 0.000
0.000 | 0.000
0.122 | 0.160
0.000 | 0.000
0.000 | 0.000
0.738 | 0.785
0.051 | 0.112
3peptides
spectra
0.000 | 0.000
1.000 | 1.000
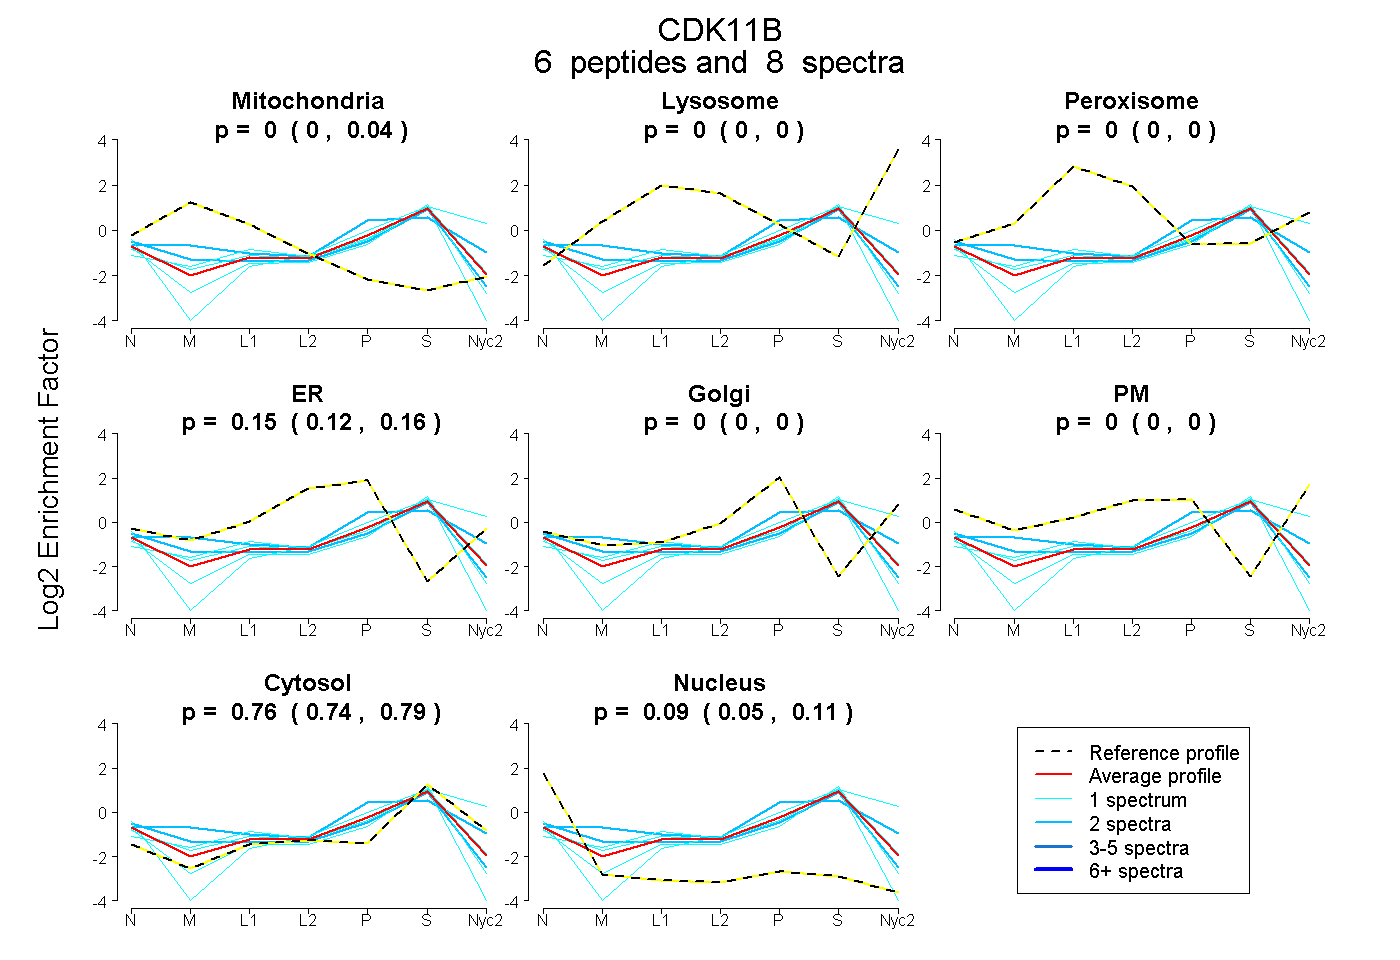
| Plot | Mito | Lyso | Perox | ER | Golgi | PM | Cytosol | Nucleus | |||||
| Expt A |
6 peptides |
8 spectra |
|
0.000 0.000 | 0.039 |
0.000 0.000 | 0.000 |
0.000 0.000 | 0.000 |
0.147 0.122 | 0.160 |
0.000 0.000 | 0.000 |
0.000 0.000 | 0.000 |
0.765 0.738 | 0.785 |
0.089 0.051 | 0.112 |
||
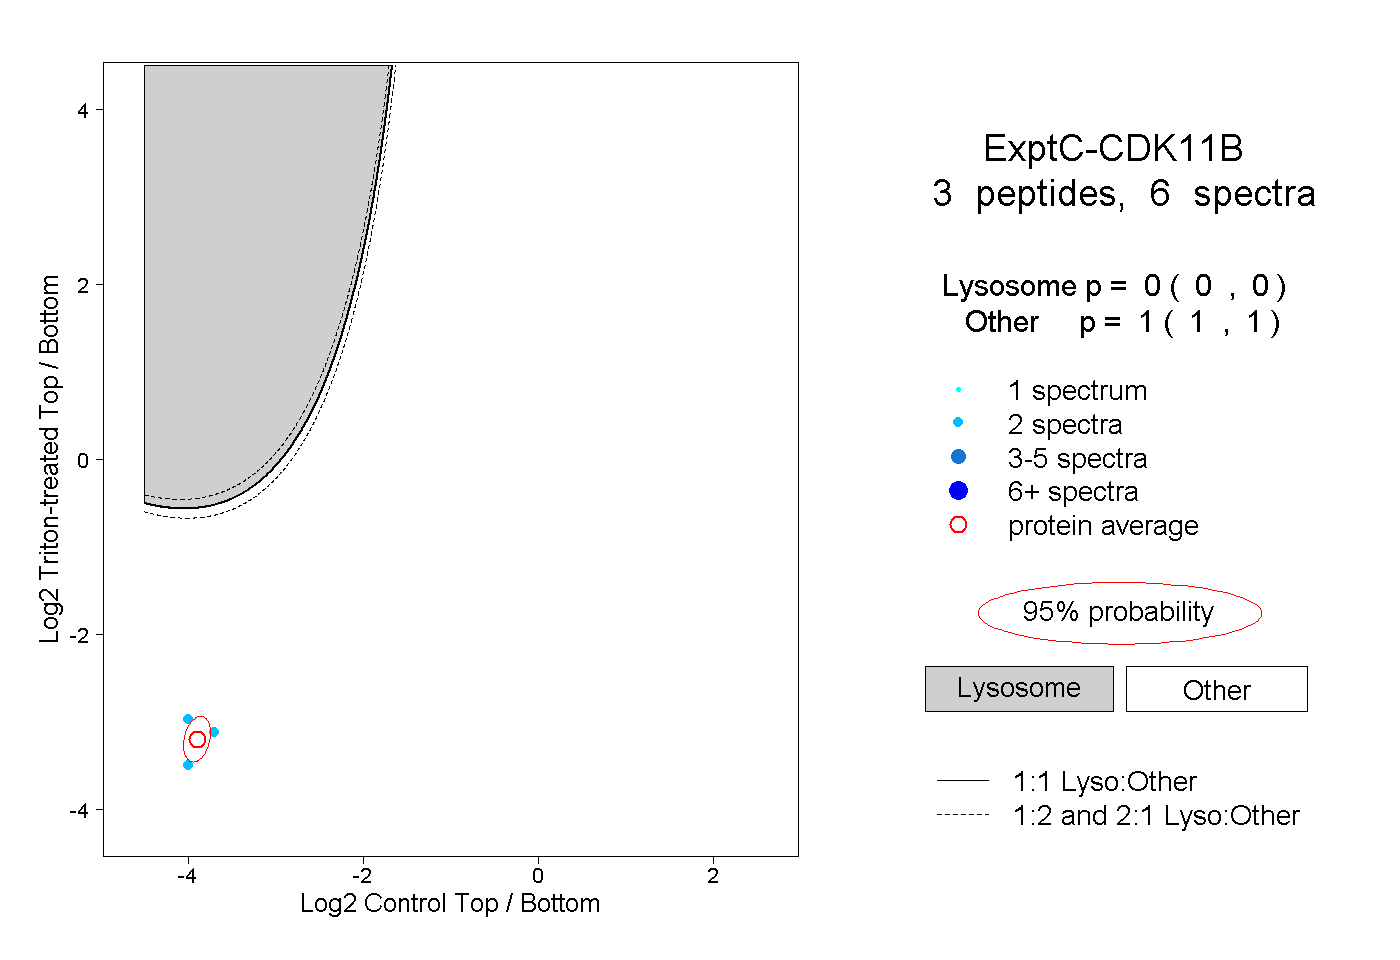
| Plot | Lyso | Other | |||||||||||
| Expt C |
3 peptides |
6 spectra |
|
0.000 0.000 | 0.000 |
1.000 1.000 | 1.000 |