 6
6peptides
spectra
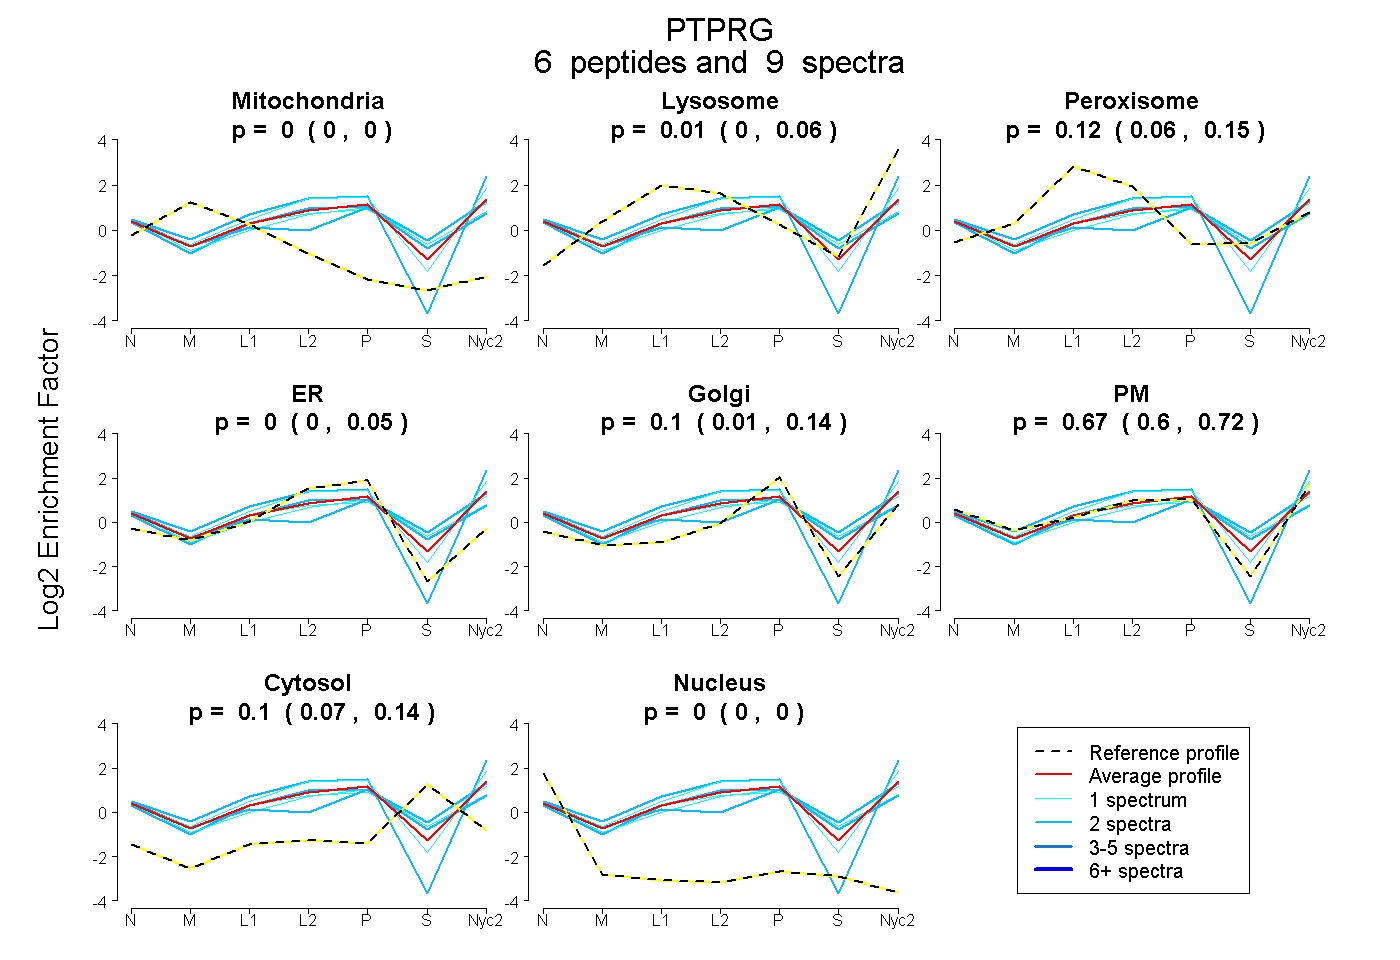
0.000 | 0.000
0.000 | 0.056
0.060 | 0.146
0.000 | 0.052
0.006 | 0.142
0.602 | 0.718
0.069 | 0.135
0.000 | 0.000
| Plot | Mito | Lyso | Perox | ER | Golgi | PM | Cytosol | Nucleus | |||||
| Expt A |
6 peptides |
9 spectra |
|
0.000 0.000 | 0.000 |
0.013 0.000 | 0.056 |
0.118 0.060 | 0.146 |
0.000 0.000 | 0.052 |
0.099 0.006 | 0.142 |
0.668 0.602 | 0.718 |
0.102 0.069 | 0.135 |
0.000 0.000 | 0.000 |
| 2 spectra, IFQGTR | 0.000 | 0.000 | 0.108 | 0.000 | 0.187 | 0.478 | 0.226 | 0.000 | ||
| 1 spectrum, STVNVLGFLK | 0.000 | 0.154 | 0.000 | 0.141 | 0.000 | 0.704 | 0.001 | 0.000 | ||
| 1 spectrum, DDYFVSGAGLPGR | 0.000 | 0.036 | 0.160 | 0.000 | 0.012 | 0.569 | 0.223 | 0.000 | ||
| 1 spectrum, GVVHHEK | 0.000 | 0.000 | 0.079 | 0.094 | 0.000 | 0.581 | 0.245 | 0.000 | ||
| 2 spectra, STFEDFWR | 0.000 | 0.042 | 0.000 | 0.000 | 0.000 | 0.958 | 0.000 | 0.000 | ||
| 2 spectra, ETFLDPFVLR | 0.000 | 0.065 | 0.116 | 0.023 | 0.000 | 0.580 | 0.217 | 0.000 |
| Plot | Lyso | Other | |||||||||||
| Expt C |
12 peptides |
22 spectra |
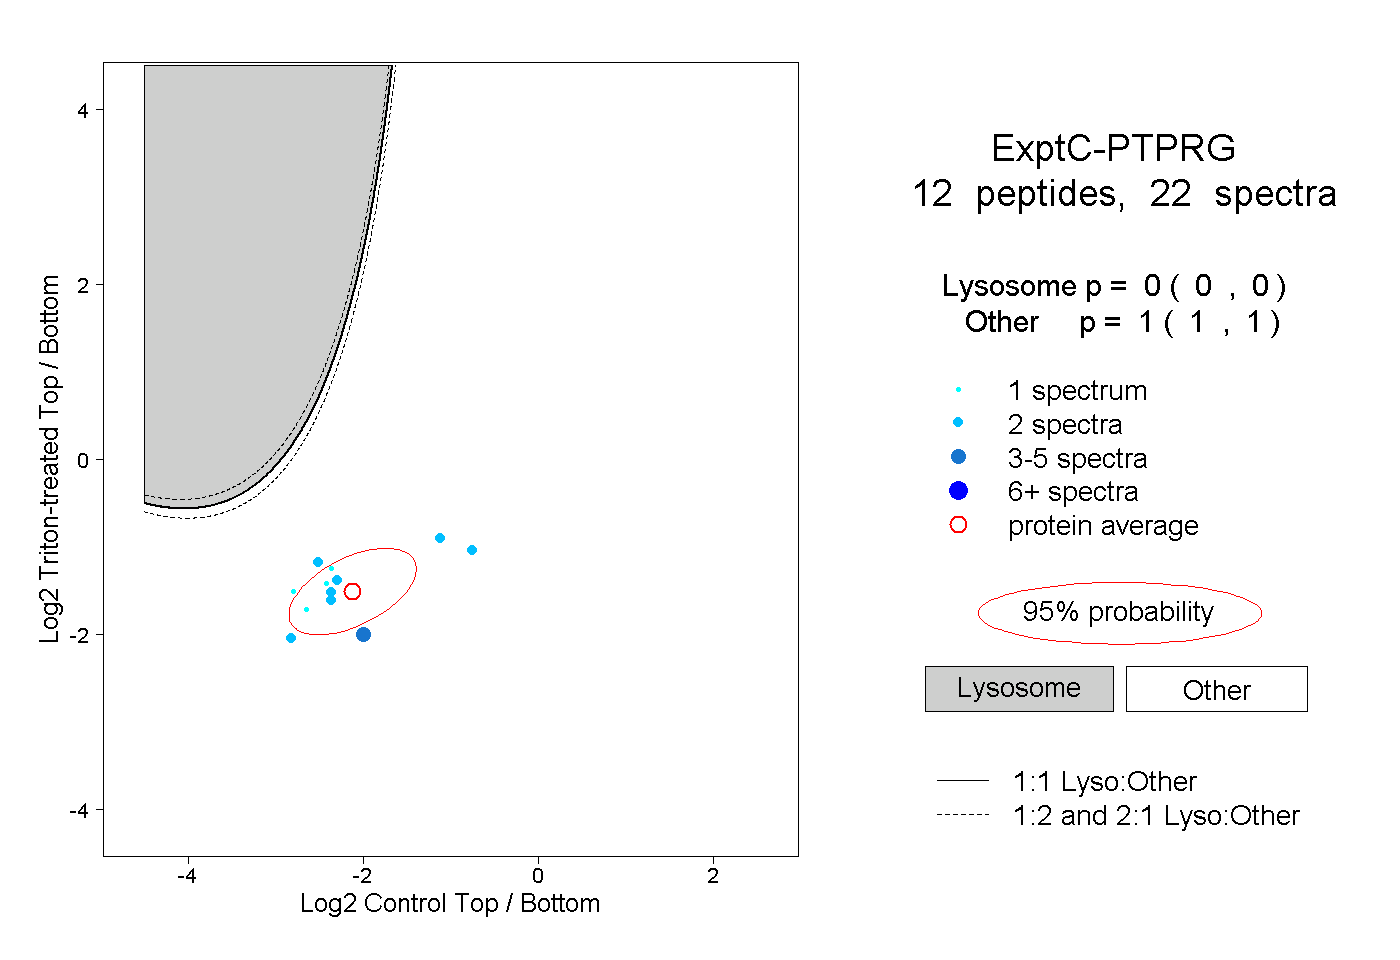 |
0.000 0.000 | 0.000 |
1.000 1.000 | 1.000 |