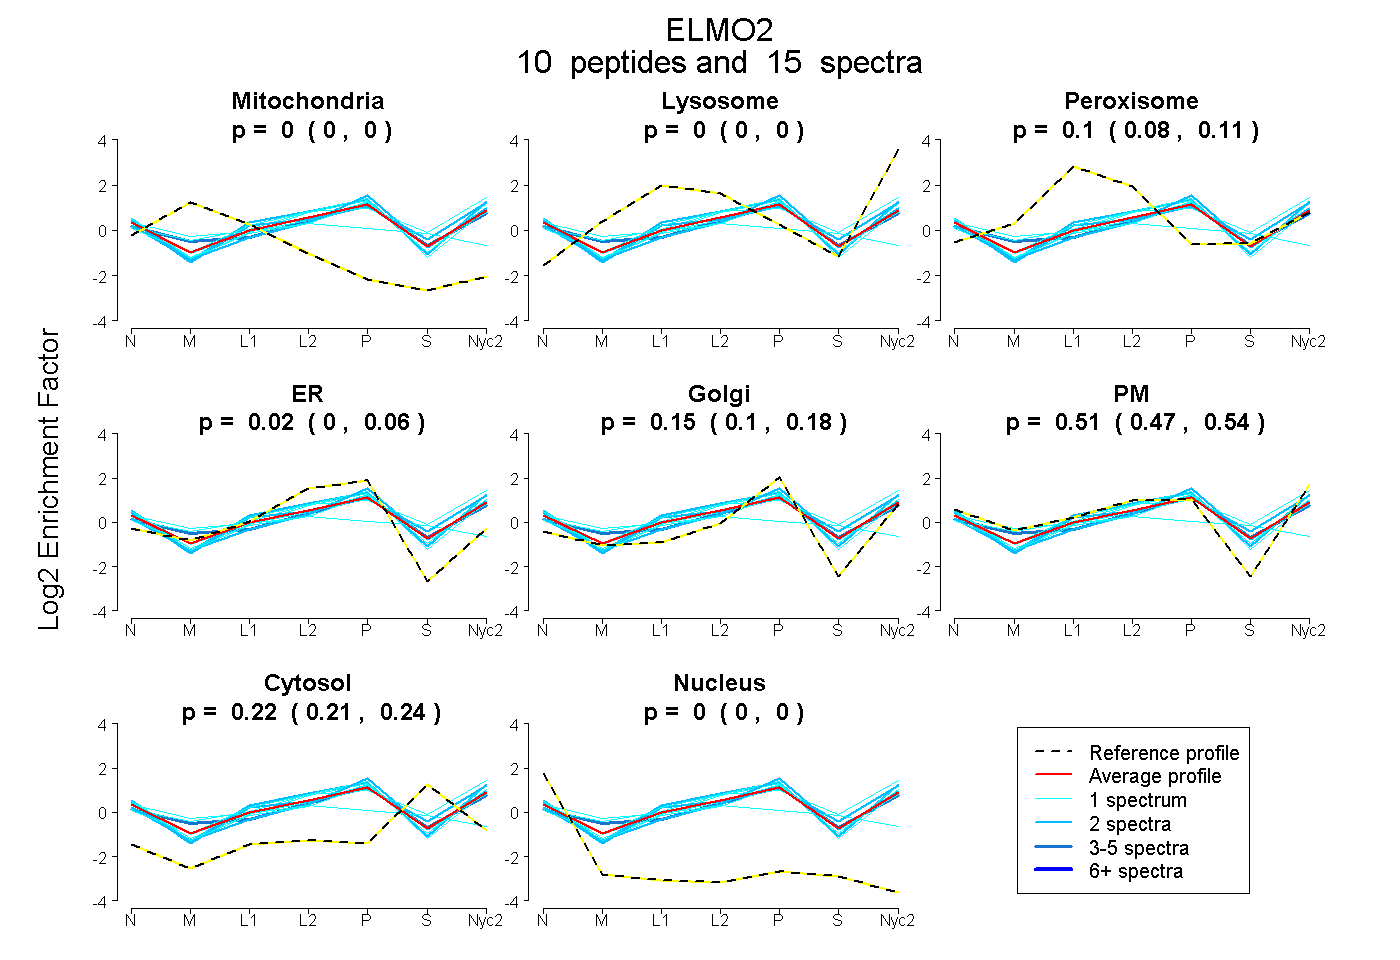
 10
10peptides
spectra
0.000 | 0.000
0.000 | 0.000
0.079 | 0.111
0.000 | 0.063
0.099 | 0.183
0.469 | 0.544
0.208 | 0.236
0.000 | 0.000
| Plot | Mito | Lyso | Perox | ER | Golgi | PM | Cytosol | Nucleus | |||||
| Expt A |
10 peptides |
15 spectra |
|
0.000 0.000 | 0.000 |
0.000 0.000 | 0.000 |
0.097 0.079 | 0.111 |
0.025 0.000 | 0.063 |
0.147 0.099 | 0.183 |
0.509 0.469 | 0.544 |
0.223 0.208 | 0.236 |
0.000 0.000 | 0.000 |
| 3 spectra, ATAEDFNK | 0.000 | 0.000 | 0.125 | 0.000 | 0.294 | 0.372 | 0.208 | 0.000 | ||
| 1 spectrum, YADGPQLYVTEQTR | 0.101 | 0.000 | 0.235 | 0.201 | 0.000 | 0.112 | 0.313 | 0.038 | ||
| 1 spectrum, IVLENSSR | 0.000 | 0.000 | 0.023 | 0.000 | 0.116 | 0.664 | 0.197 | 0.000 | ||
| 1 spectrum, MDPNDQAQR | 0.000 | 0.000 | 0.000 | 0.130 | 0.005 | 0.656 | 0.209 | 0.000 | ||
| 2 spectra, SIILNHVIR | 0.000 | 0.019 | 0.053 | 0.000 | 0.000 | 0.647 | 0.280 | 0.000 | ||
| 1 spectrum, LALNHK | 0.000 | 0.000 | 0.190 | 0.051 | 0.352 | 0.335 | 0.072 | 0.000 | ||
| 2 spectra, IQPEILELIK | 0.000 | 0.000 | 0.063 | 0.073 | 0.044 | 0.664 | 0.156 | 0.000 | ||
| 2 spectra, RPLASVIK | 0.000 | 0.000 | 0.045 | 0.000 | 0.371 | 0.378 | 0.206 | 0.000 | ||
| 1 spectrum, SLSYSEILR | 0.000 | 0.000 | 0.009 | 0.041 | 0.120 | 0.563 | 0.266 | 0.000 | ||
| 1 spectrum, VHQDTYIR | 0.000 | 0.174 | 0.054 | 0.000 | 0.000 | 0.497 | 0.274 | 0.000 |
| Plot | Mito | Lyso or Perox | ER | Golgi | PM | Cytosol | Nucleus | ||||||
| Expt B |
3 peptides |
4 spectra |
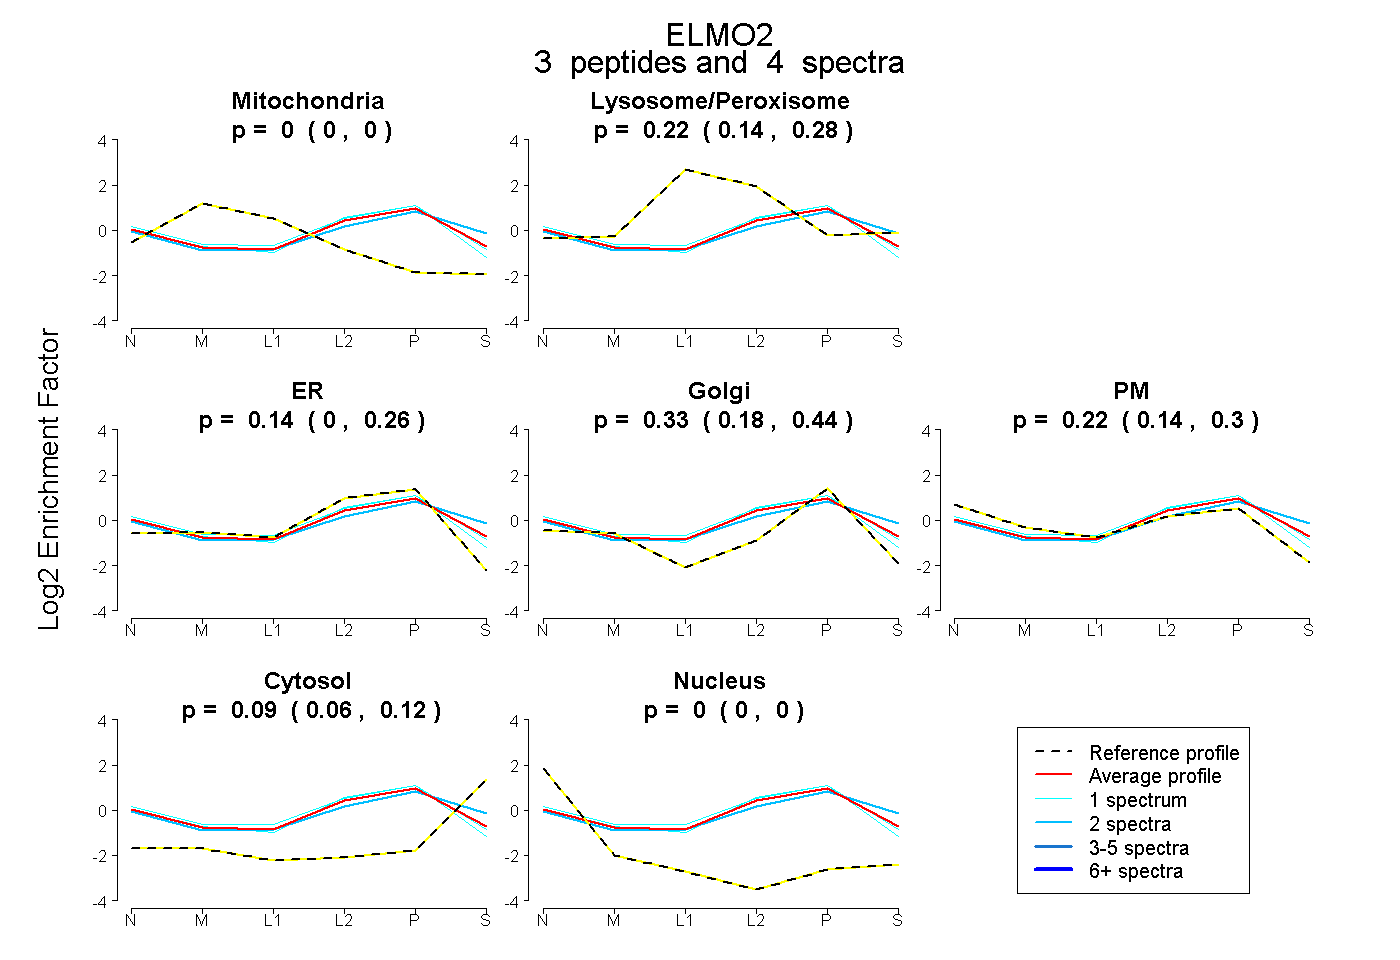 |
0.000 0.000 | 0.000 |
0.215 0.145 | 0.276 |
0.144 0.000 | 0.256 |
0.325 0.181 | 0.442 |
0.224 0.143 | 0.296 |
0.092 0.058 | 0.120 |
0.000 0.000 | 0.000 |
|||
| Plot | Lyso | Other | |||||||||||
| Expt C |
4 peptides |
11 spectra |
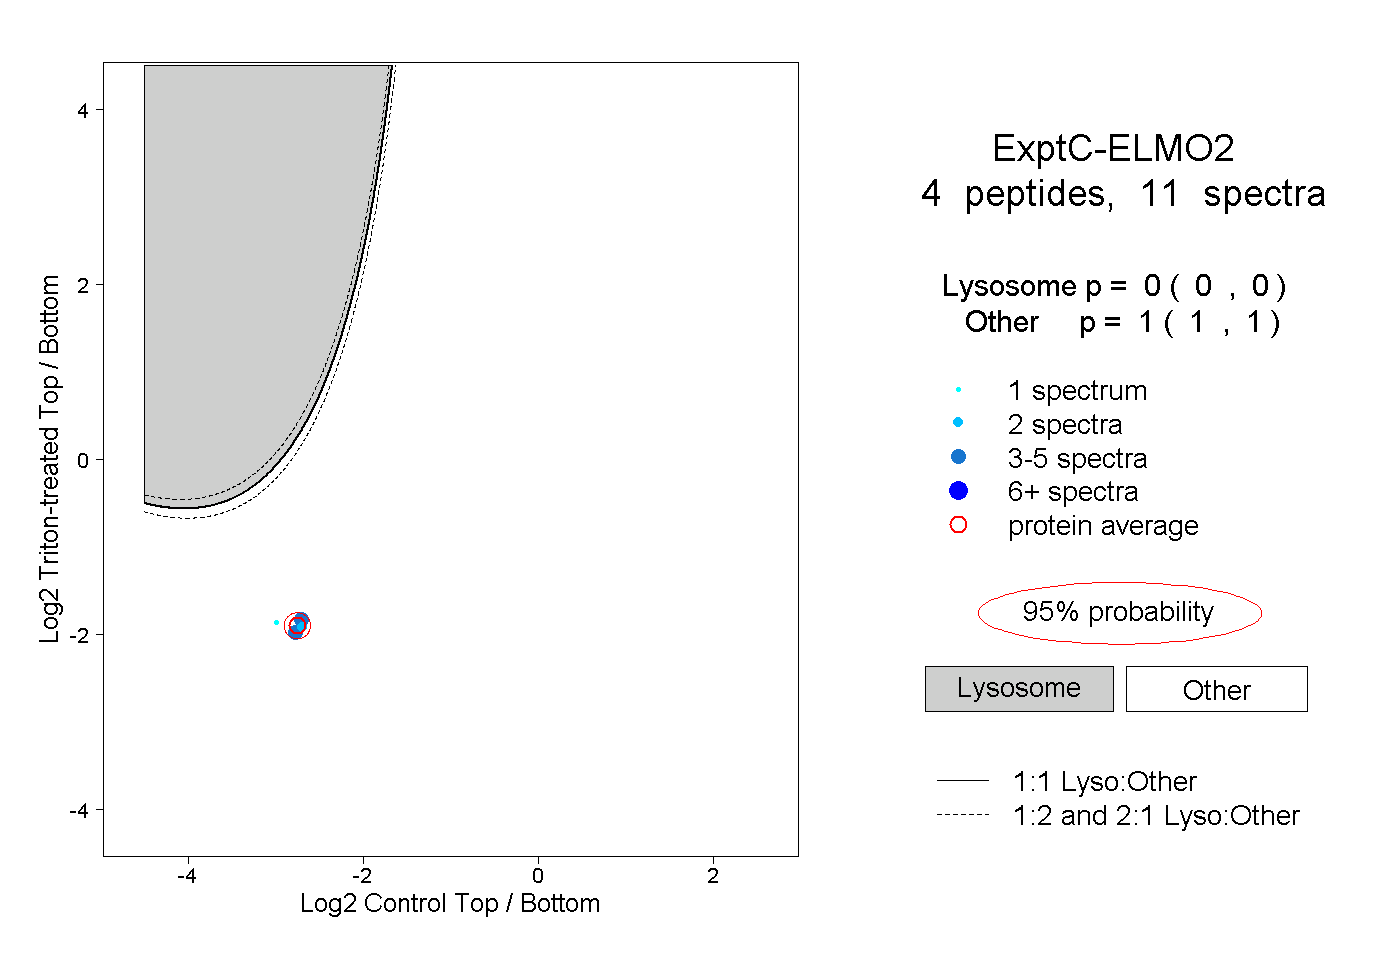 |
0.000 0.000 | 0.000 |
1.000 1.000 | 1.000 |