 2
2peptides
spectra
0.000 | 0.000
0.000 | 0.000
0.000 | 0.000
0.000 | 0.215
0.000 | 0.223
0.000 | 0.000
0.477 | 0.547
0.226 | 0.315
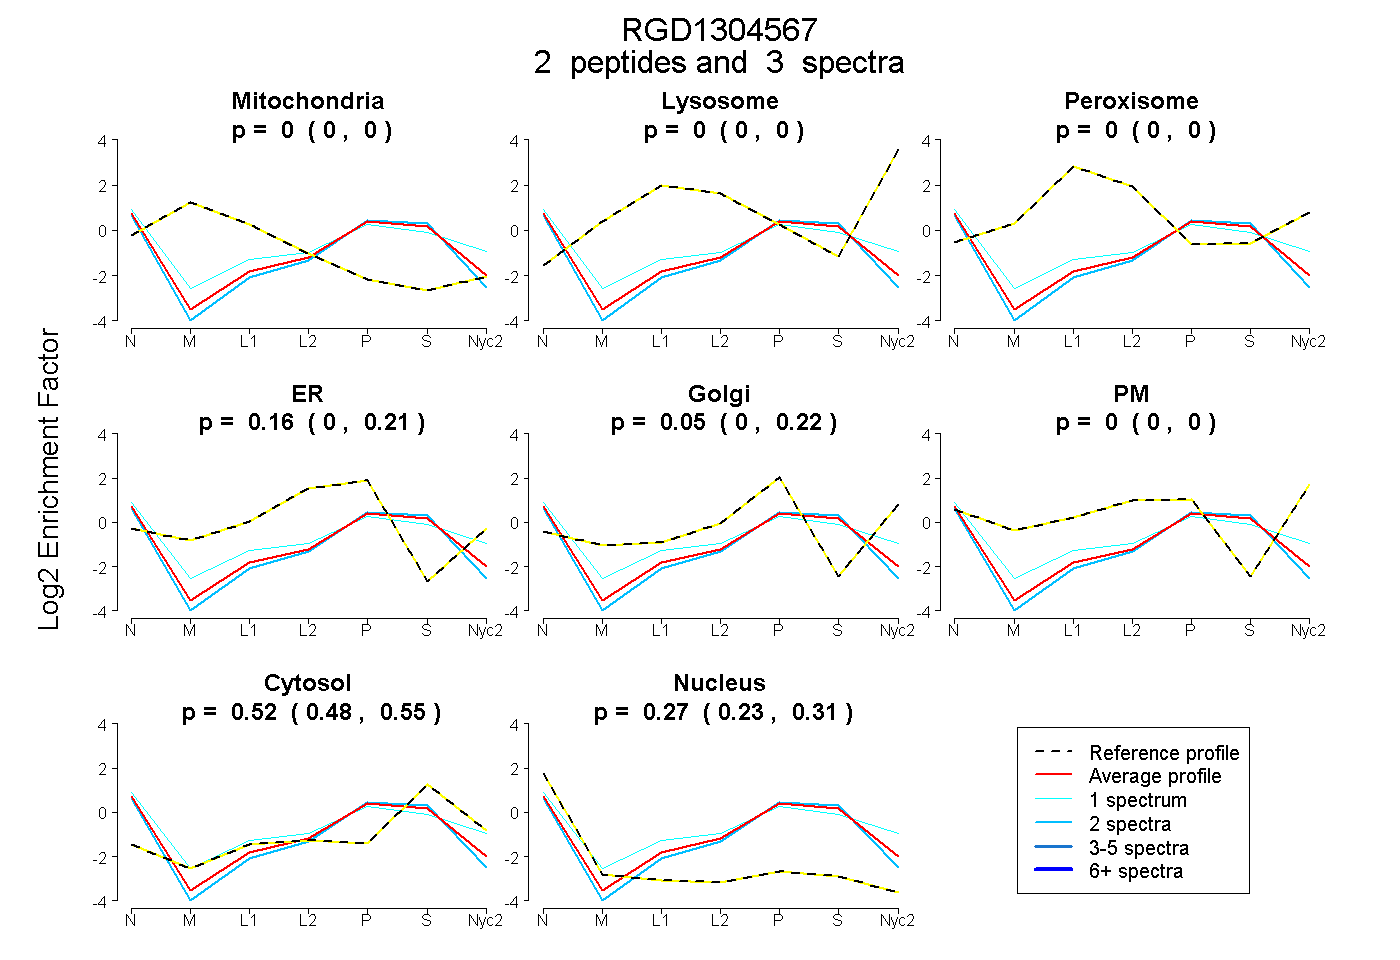
| Plot | Mito | Lyso | Perox | ER | Golgi | PM | Cytosol | Nucleus | |||||
| Expt A |
2 peptides |
3 spectra |
|
0.000 0.000 | 0.000 |
0.000 0.000 | 0.000 |
0.000 0.000 | 0.000 |
0.161 0.000 | 0.215 |
0.046 0.000 | 0.223 |
0.000 0.000 | 0.000 |
0.519 0.477 | 0.547 |
0.275 0.226 | 0.315 |
| 2 spectra, AEEGLPTAPR | 0.000 | 0.000 | 0.000 | 0.138 | 0.000 | 0.000 | 0.547 | 0.315 | ||
| 1 spectrum, SCSSTSLASAGDIASSTSAK | 0.000 | 0.000 | 0.000 | 0.080 | 0.159 | 0.113 | 0.450 | 0.198 |