 4
4peptides
spectra

0.000 | 0.012
0.000 | 0.077
0.000 | 0.234
0.066 | 0.374
0.000 | 0.249
0.345 | 0.636
0.000 | 0.000
0.000 | 0.000
3peptides
spectra
0.000 | 0.000
1.000 | 1.000
| Plot | Mito | Lyso | Perox | ER | Golgi | PM | Cytosol | Nucleus | |||||
| Expt A |
4 peptides |
5 spectra |
|
0.000 0.000 | 0.012 |
0.011 0.000 | 0.077 |
0.133 0.000 | 0.234 |
0.251 0.066 | 0.374 |
0.075 0.000 | 0.249 |
0.530 0.345 | 0.636 |
0.000 0.000 | 0.000 |
0.000 0.000 | 0.000 |
||
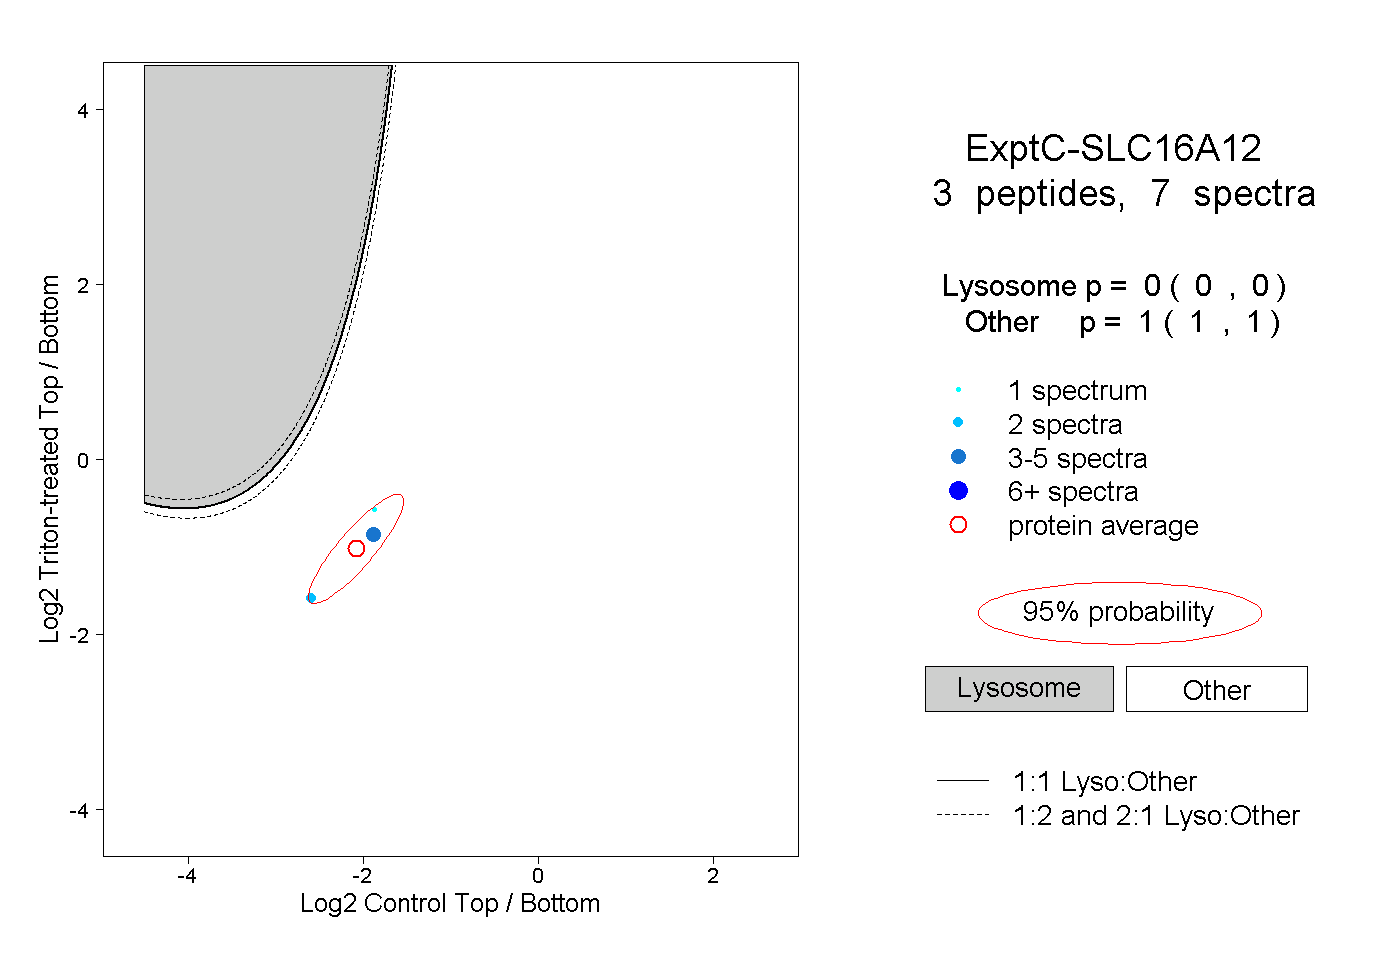
| Plot | Lyso | Other | |||||||||||
| Expt C |
3 peptides |
7 spectra |
|
0.000 0.000 | 0.000 |
1.000 1.000 | 1.000 |