 3
3peptides
spectra
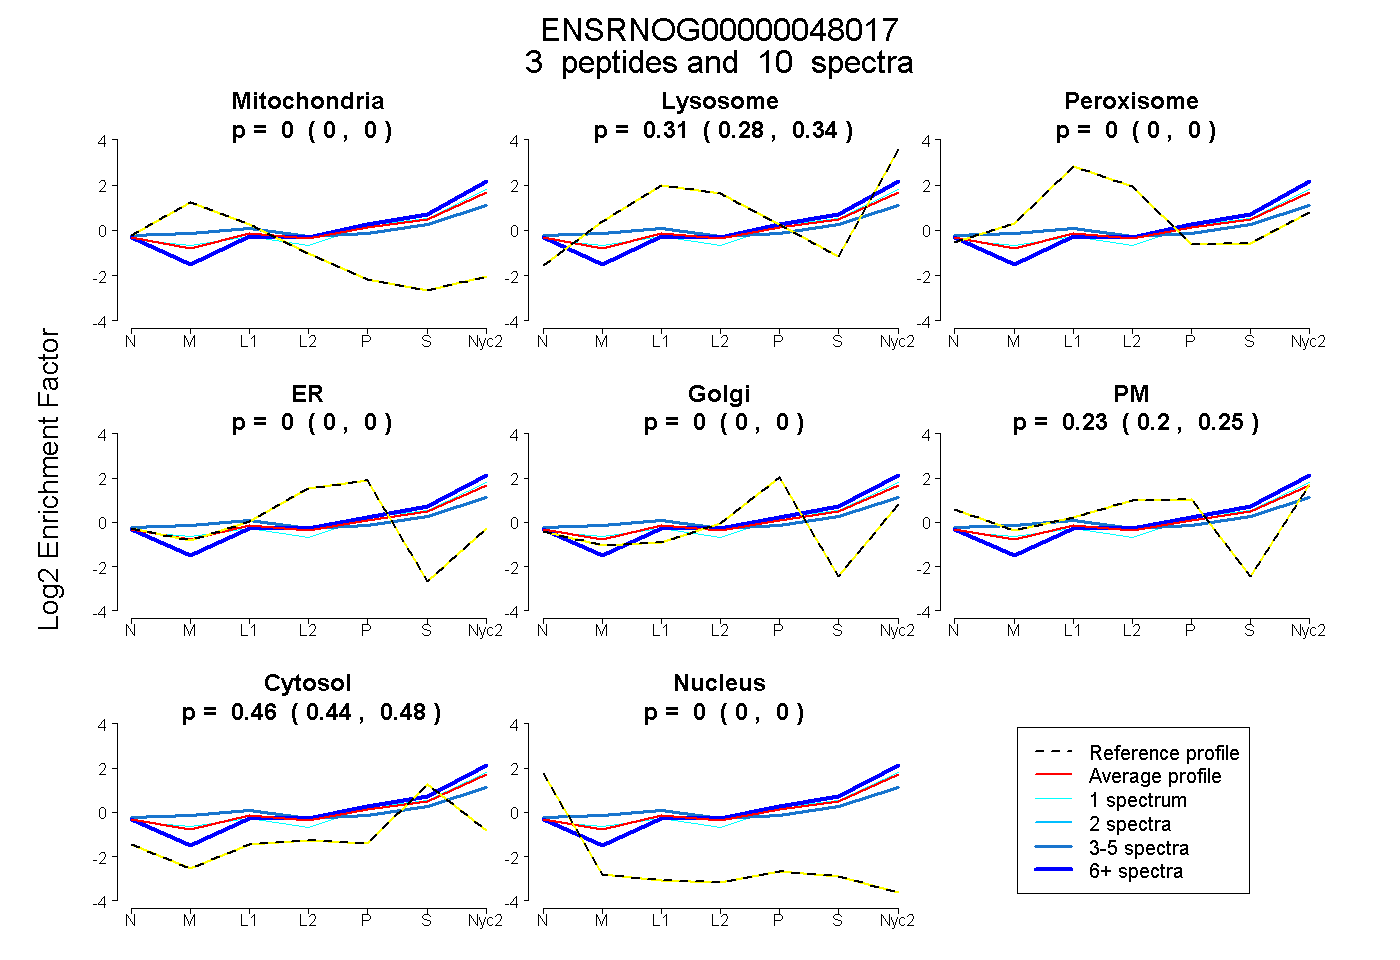
0.000 | 0.000
0.281 | 0.340
0.000 | 0.000
0.000 | 0.000
0.000 | 0.000
0.204 | 0.250
0.437 | 0.476
0.000 | 0.000
1peptide
spectra
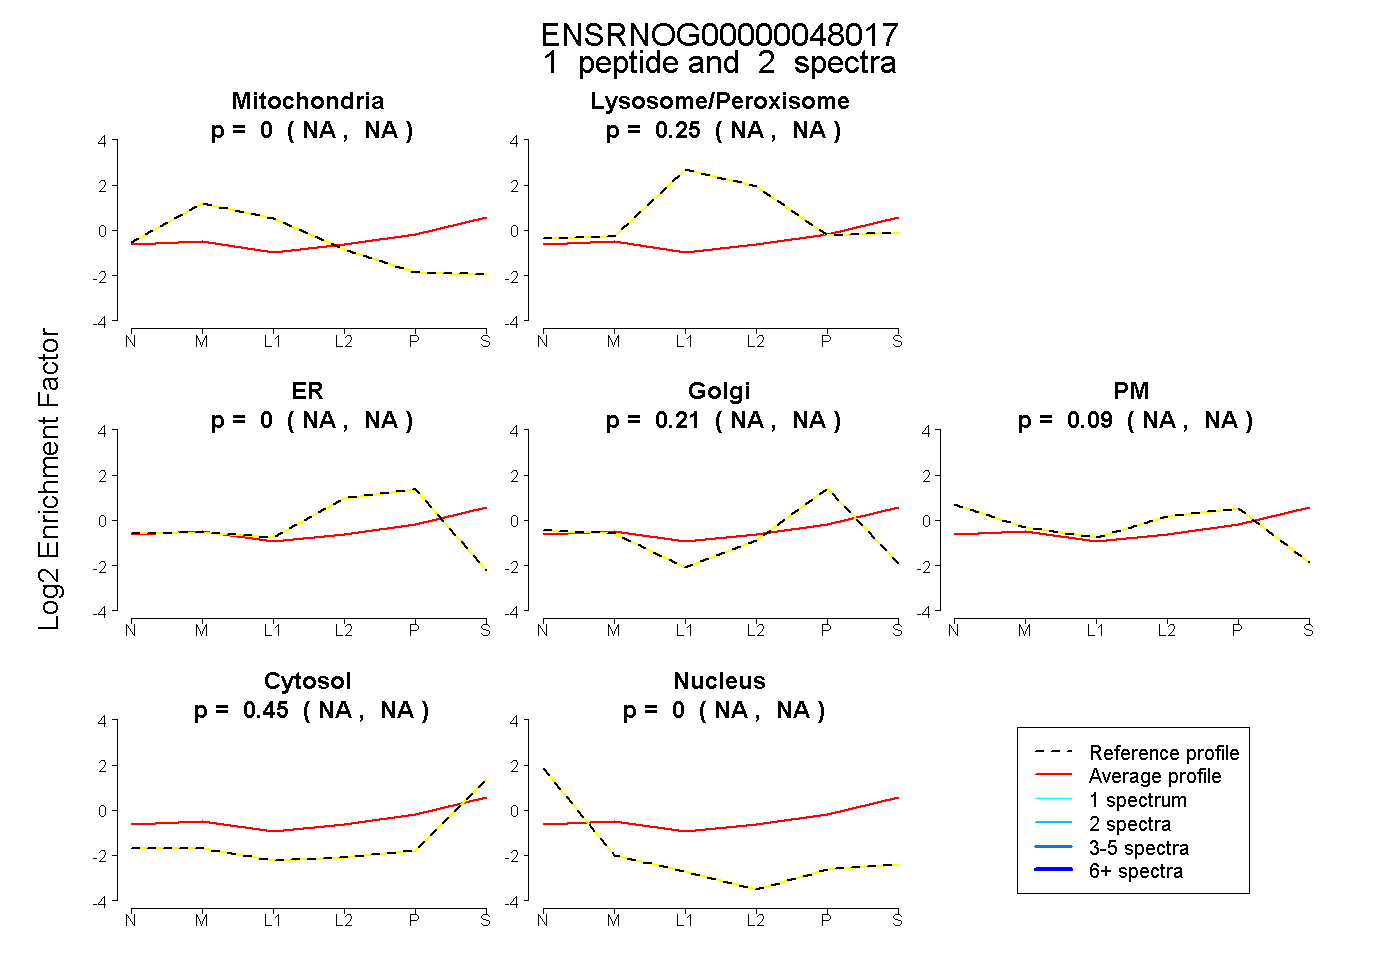
NA | NA
NA | NA
NA | NA
NA | NA
NA | NA
NA | NA
NA | NA
1peptide
spectra
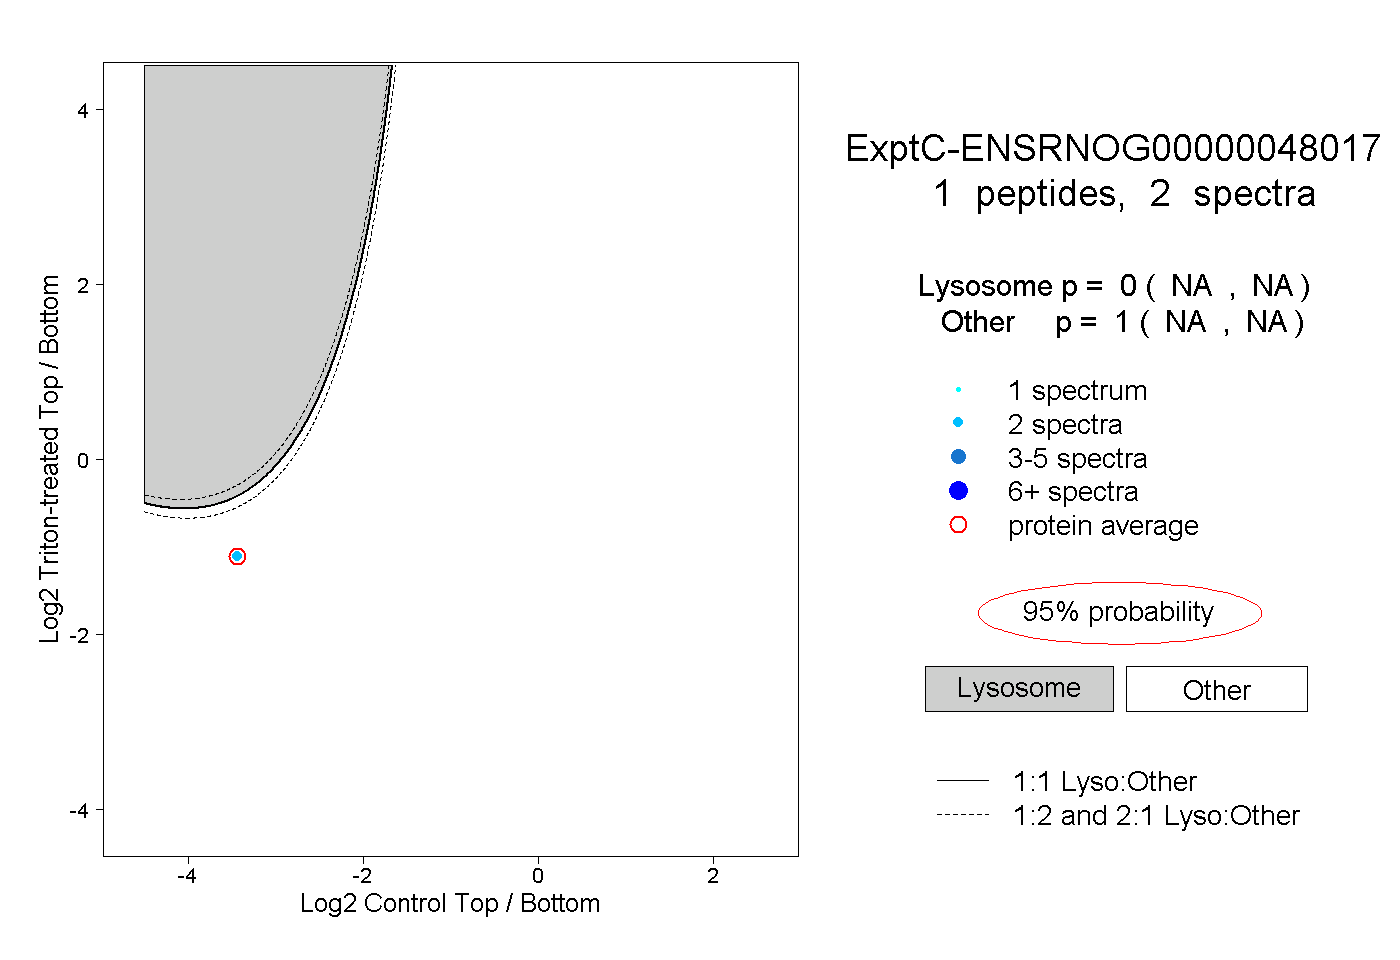
NA | NA
NA | NA