 2
2peptides
spectra
0.000 | 0.120
0.000 | 0.251
0.000 | 0.174
0.000 | 0.221
0.000 | 0.139
0.152 | 0.670
0.145 | 0.429
0.000 | 0.056
1peptide
spectrum

NA | NA
NA | NA
| Plot | Mito | Lyso | Perox | ER | Golgi | PM | Cytosol | Nucleus | |||||
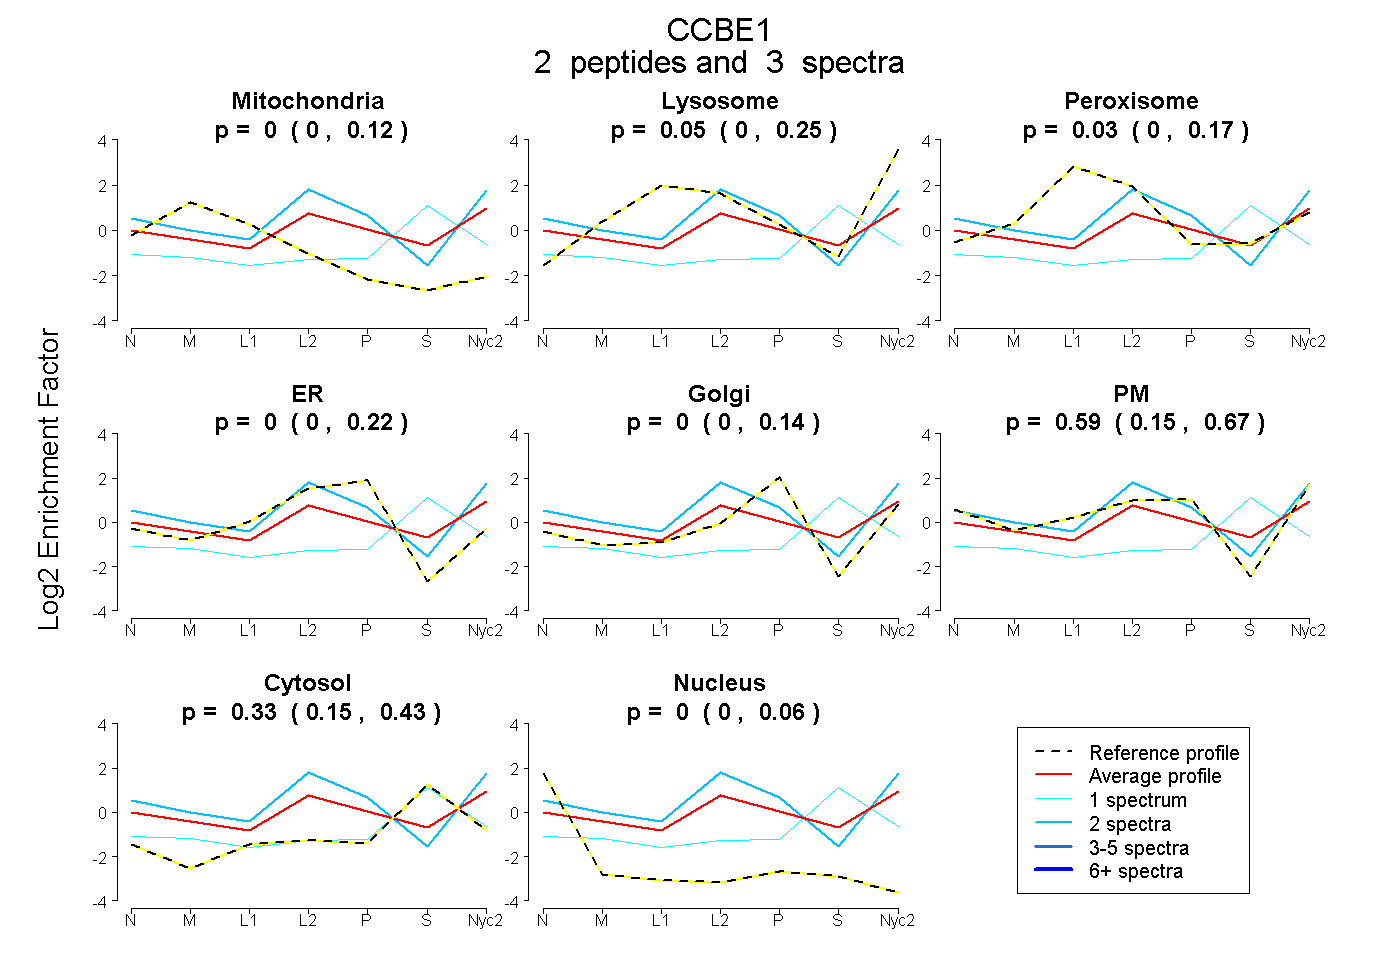
| Expt A |
2 peptides |
3 spectra |
|
0.004 0.000 | 0.120 |
0.050 0.000 | 0.251 |
0.027 0.000 | 0.174 |
0.000 0.000 | 0.221 |
0.000 0.000 | 0.139 |
0.589 0.152 | 0.670 |
0.331 0.145 | 0.429 |
0.000 0.000 | 0.056 |
||
| Plot | Lyso | Other | |||||||||||
| Expt C |
1 peptide |
1 spectrum |
|
0.000 NA | NA |
1.000 NA | NA |