 3
3peptides
spectra
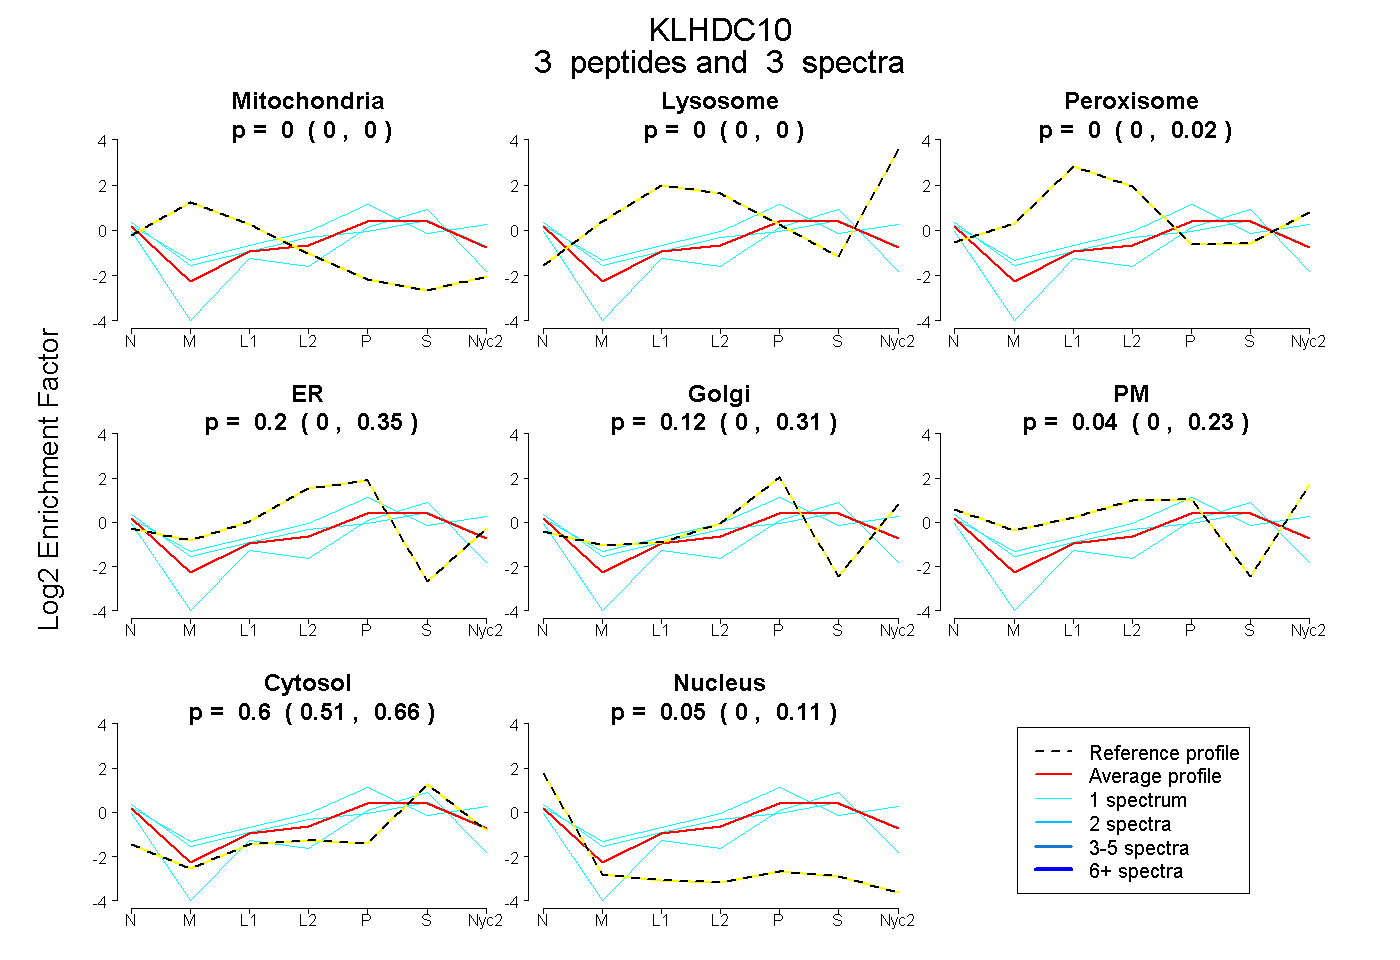
0.000 | 0.000
0.000 | 0.000
0.000 | 0.019
0.000 | 0.347
0.000 | 0.310
0.000 | 0.229
0.512 | 0.658
0.000 | 0.110
| Plot | Mito | Lyso | Perox | ER | Golgi | PM | Cytosol | Nucleus | |||||
| Expt A |
3 peptides |
3 spectra |
|
0.000 0.000 | 0.000 |
0.000 0.000 | 0.000 |
0.000 0.000 | 0.019 |
0.200 0.000 | 0.347 |
0.118 0.000 | 0.310 |
0.037 0.000 | 0.229 |
0.597 0.512 | 0.658 |
0.047 0.000 | 0.110 |