10
10peptides
spectra
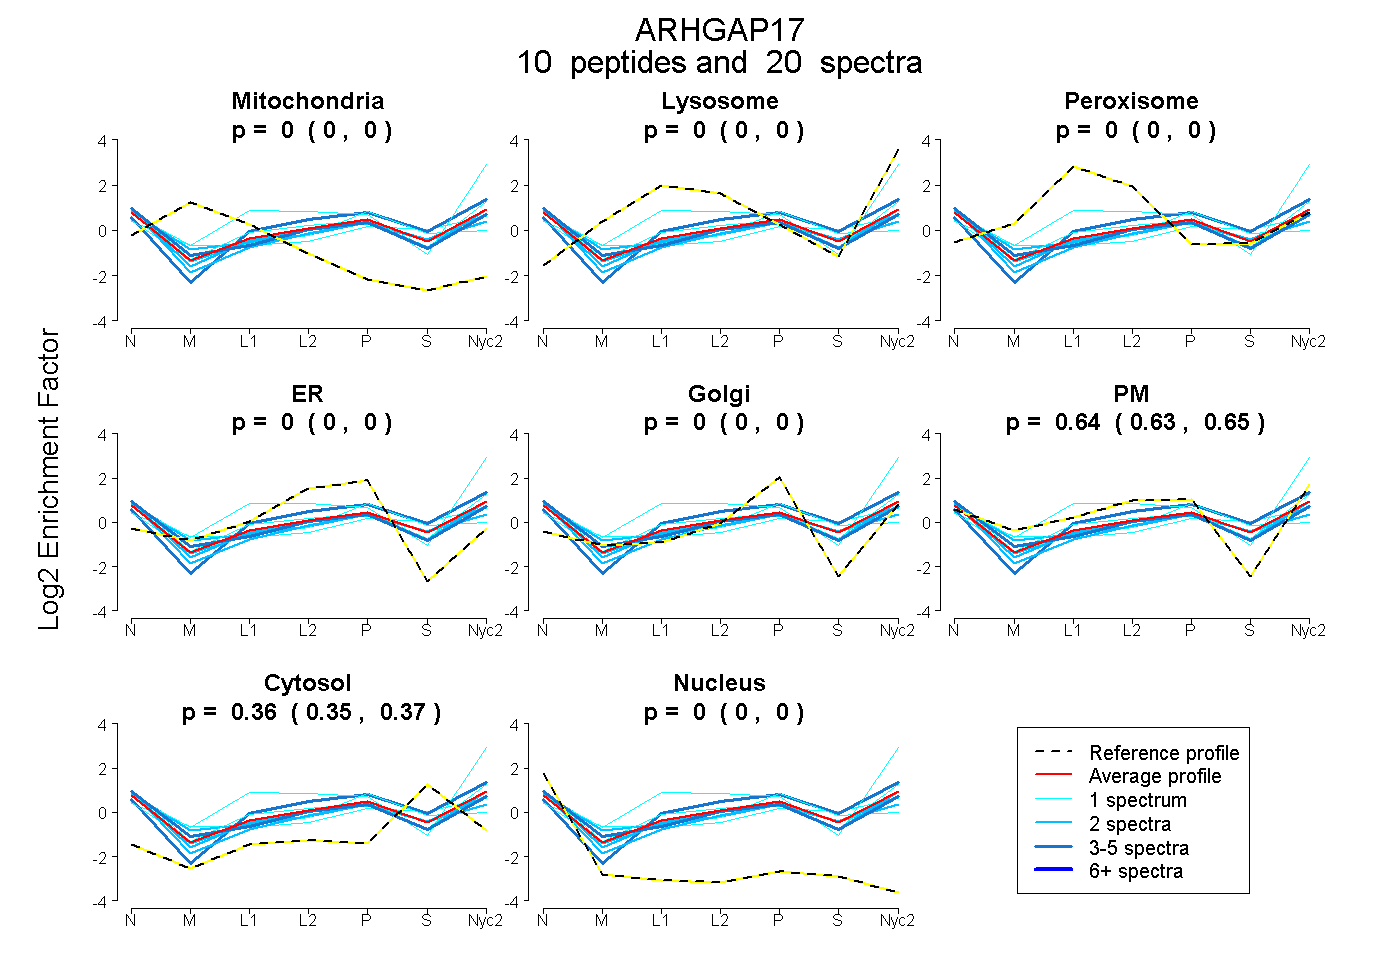
0.000 | 0.000
0.000 | 0.000
0.000 | 0.000
0.000 | 0.000
0.000 | 0.000
0.628 | 0.646
0.352 | 0.370
0.000 | 0.001
3peptides
spectra
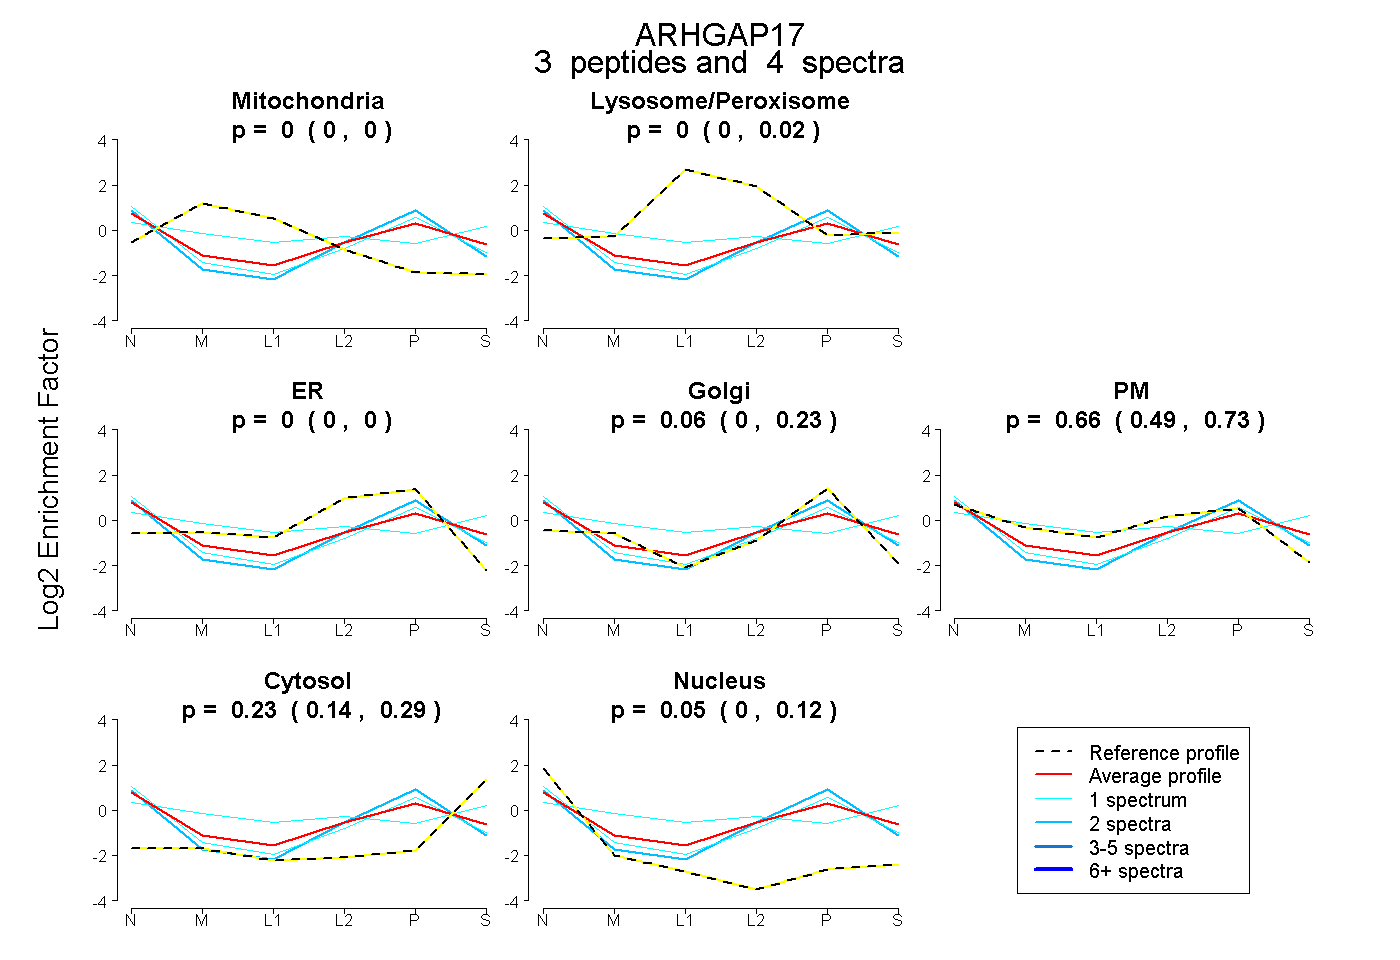
0.000 | 0.000
0.000 | 0.016
0.000 | 0.000
0.000 | 0.231
0.485 | 0.734
0.136 | 0.294
0.000 | 0.117