 10
10peptides
spectra
0.000 | 0.000
0.000 | 0.000
0.000 | 0.000
0.000 | 0.000
0.000 | 0.000
0.628 | 0.646
0.352 | 0.370
0.000 | 0.001
| Plot | Mito | Lyso | Perox | ER | Golgi | PM | Cytosol | Nucleus | |||||
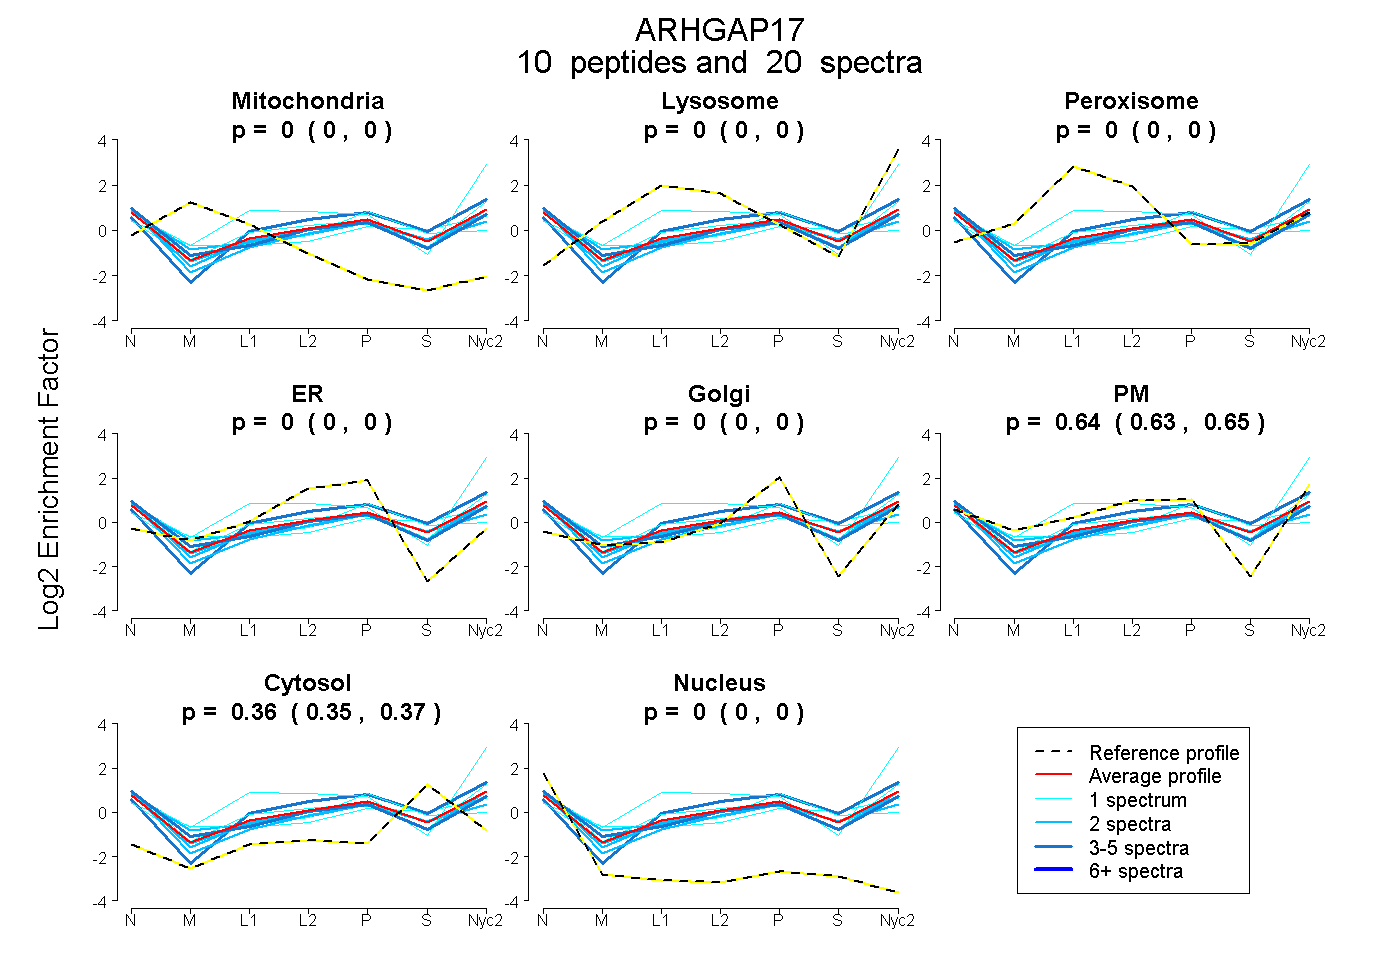
| Expt A |
10 peptides |
20 spectra |
|
0.000 0.000 | 0.000 |
0.000 0.000 | 0.000 |
0.000 0.000 | 0.000 |
0.000 0.000 | 0.000 |
0.000 0.000 | 0.000 |
0.638 0.628 | 0.646 |
0.362 0.352 | 0.370 |
0.000 0.000 | 0.001 |
| 2 spectra, QLANQTVGR | 0.000 | 0.000 | 0.000 | 0.000 | 0.000 | 0.562 | 0.386 | 0.052 | ||
| 4 spectra, DSVSAAAPVAGR | 0.000 | 0.028 | 0.000 | 0.000 | 0.000 | 0.596 | 0.376 | 0.000 | ||
| 1 spectrum, DQLAADMYNFMAK | 0.004 | 0.000 | 0.000 | 0.000 | 0.000 | 0.532 | 0.464 | 0.000 | ||
| 2 spectra, LPPQNFVNFR | 0.000 | 0.000 | 0.000 | 0.000 | 0.000 | 0.578 | 0.370 | 0.052 | ||
| 1 spectrum, SSGTNFQGLPSK | 0.000 | 0.338 | 0.000 | 0.000 | 0.000 | 0.606 | 0.056 | 0.000 | ||
| 2 spectra, FFVTLLEAQADYHR | 0.000 | 0.000 | 0.000 | 0.000 | 0.000 | 0.679 | 0.295 | 0.027 | ||
| 1 spectrum, EIMDPLYGIAEVEIPNIQK | 0.000 | 0.000 | 0.000 | 0.102 | 0.117 | 0.347 | 0.432 | 0.003 | ||
| 1 spectrum, LVLDWDSVR | 0.000 | 0.000 | 0.000 | 0.000 | 0.000 | 0.706 | 0.294 | 0.000 | ||
| 4 spectra, TEVLSEDLLQIER | 0.000 | 0.000 | 0.000 | 0.000 | 0.000 | 0.648 | 0.288 | 0.064 | ||
| 2 spectra, EGEYGK | 0.000 | 0.000 | 0.000 | 0.000 | 0.000 | 0.572 | 0.372 | 0.056 |
| Plot | Mito | Lyso or Perox | ER | Golgi | PM | Cytosol | Nucleus | ||||||
| Expt B |
3 peptides |
4 spectra |
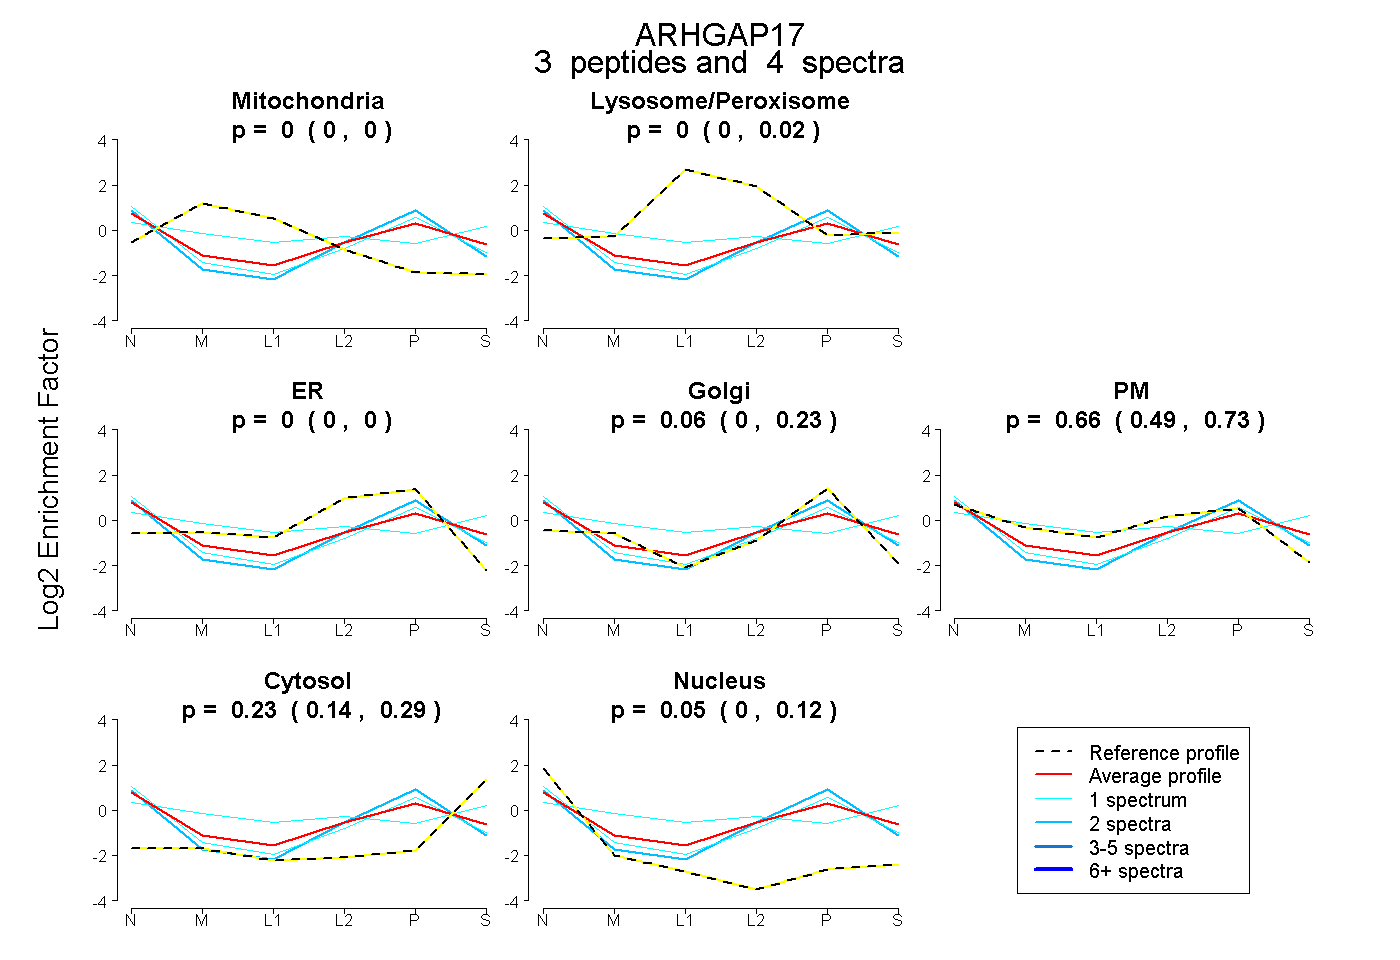 |
0.000 0.000 | 0.000 |
0.000 0.000 | 0.016 |
0.000 0.000 | 0.000 |
0.060 0.000 | 0.231 |
0.659 0.485 | 0.734 |
0.227 0.136 | 0.294 |
0.055 0.000 | 0.117 |
|||
| Plot | Lyso | Other | |||||||||||
| Expt C |
6 peptides |
23 spectra |
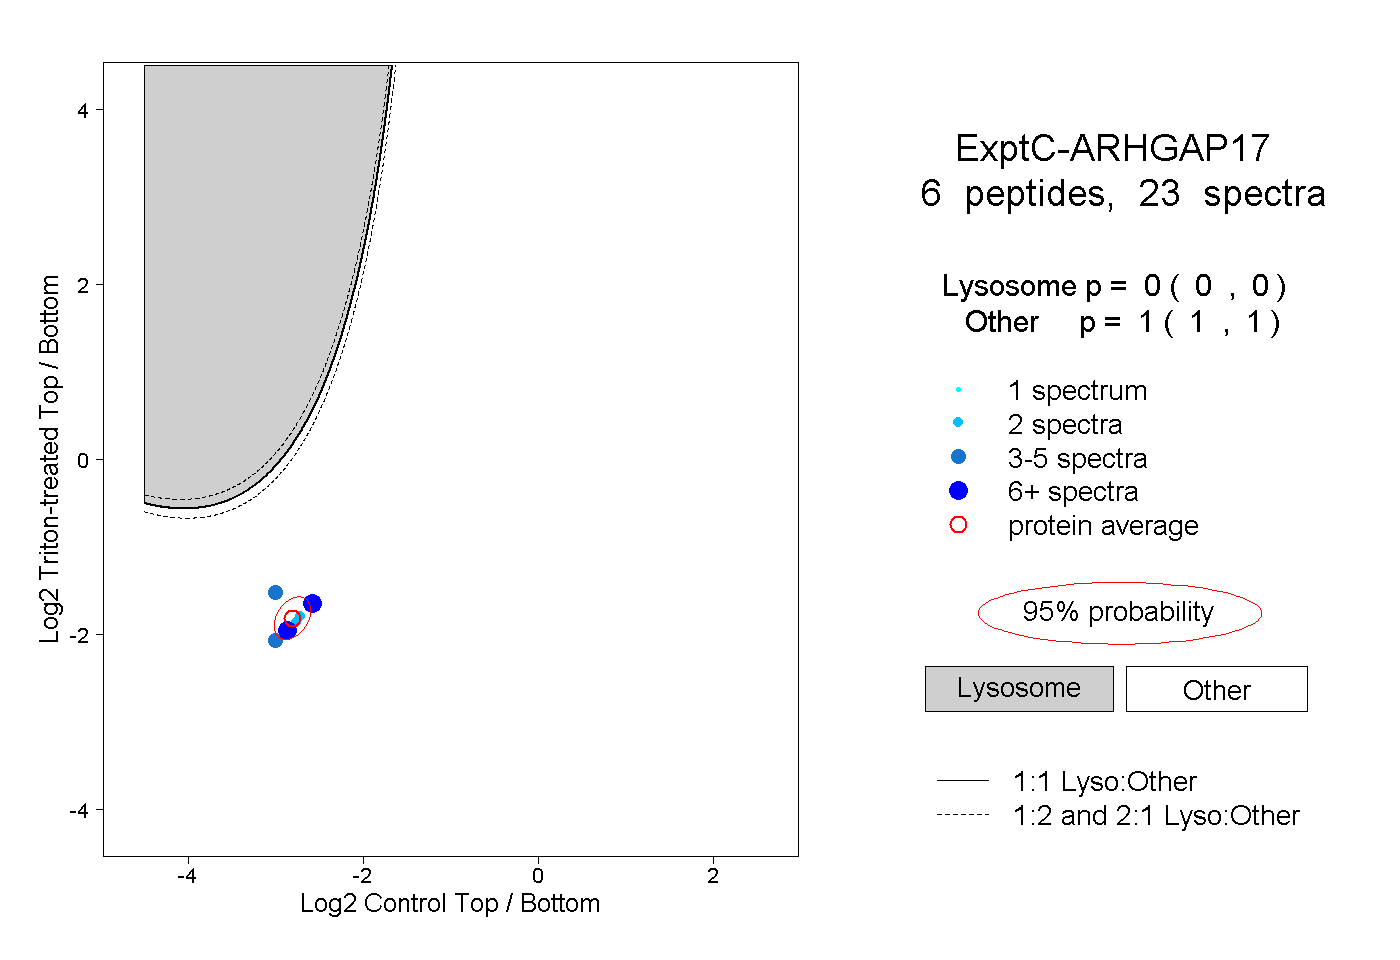 |
0.000 0.000 | 0.000 |
1.000 1.000 | 1.000 |
||||||||
| Plot | Lyso | Other | |||||||||||
| Expt D |
1 peptide |
2 spectra |
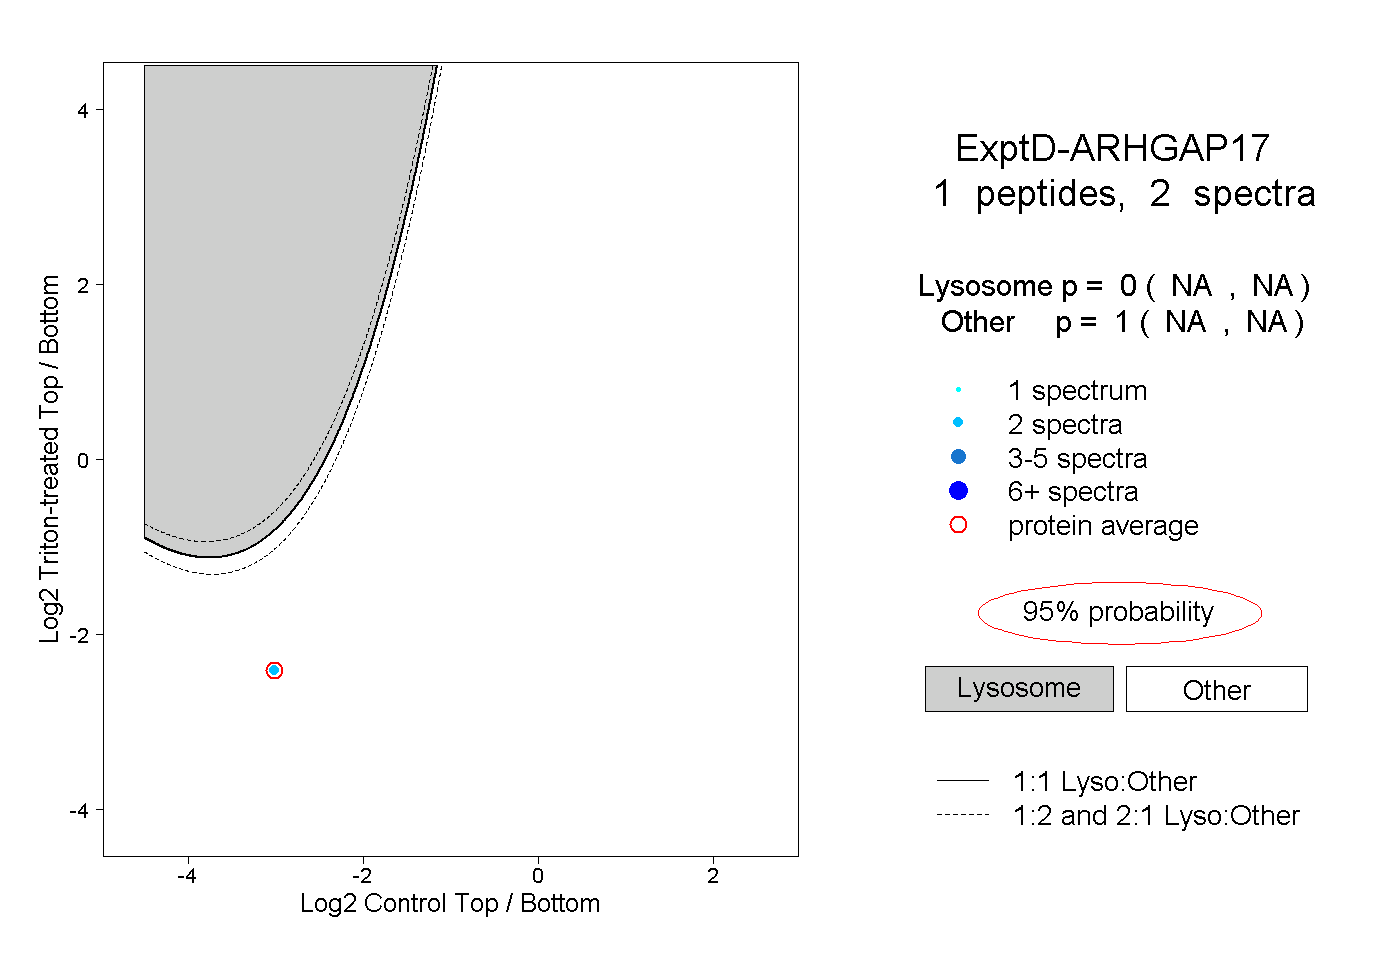 |
0.000 NA | NA |
1.000 NA | NA |