19
19peptides
spectra
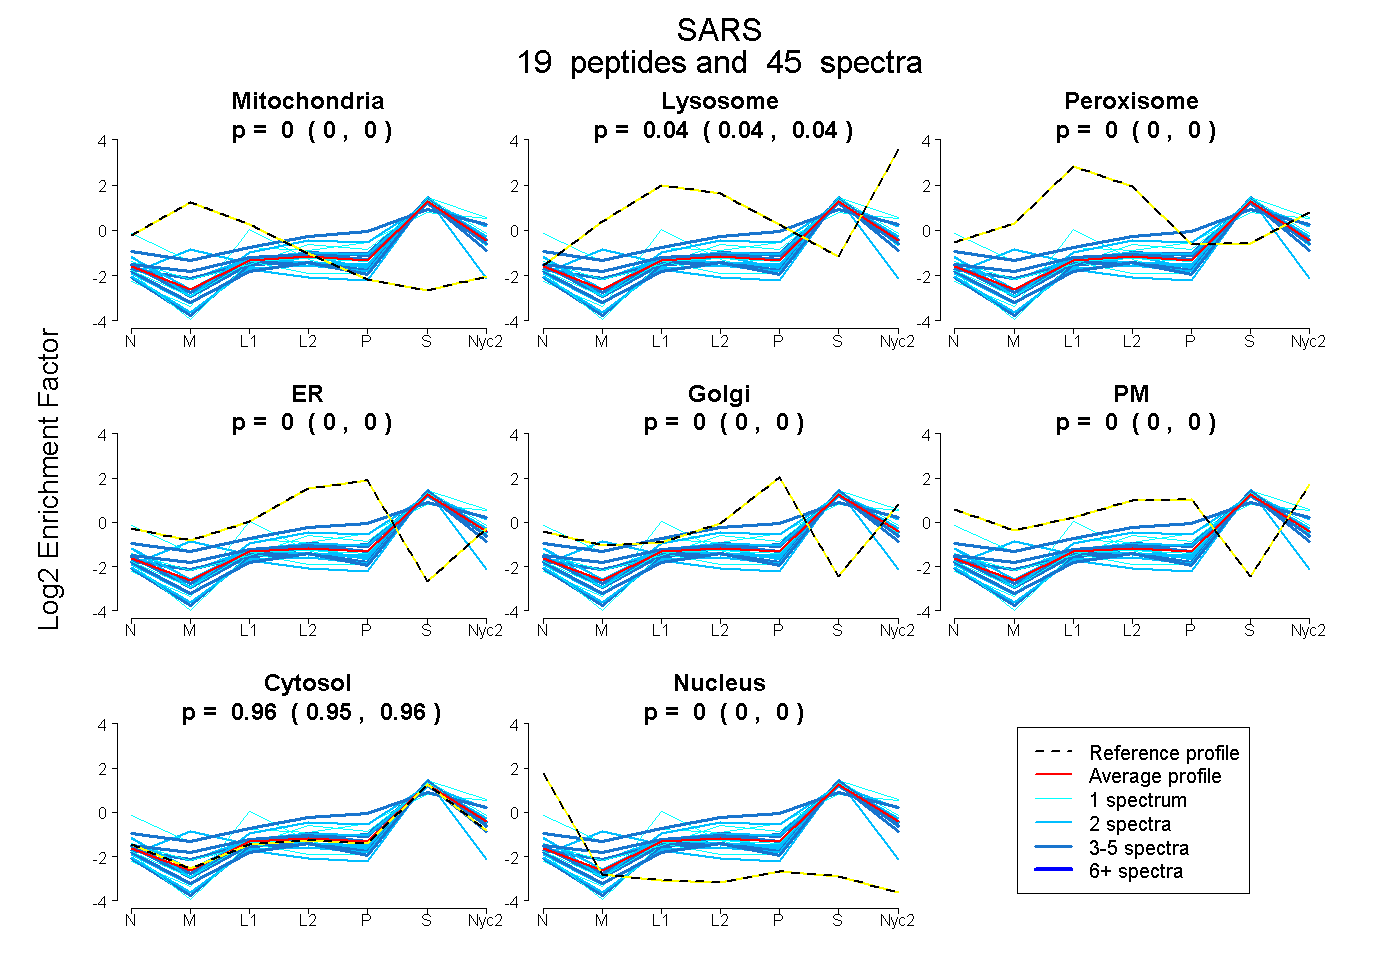
0.000 | 0.000
0.035 | 0.045
0.000 | 0.000
0.000 | 0.000
0.000 | 0.000
0.000 | 0.000
0.955 | 0.964
0.000 | 0.000
8peptides
spectra
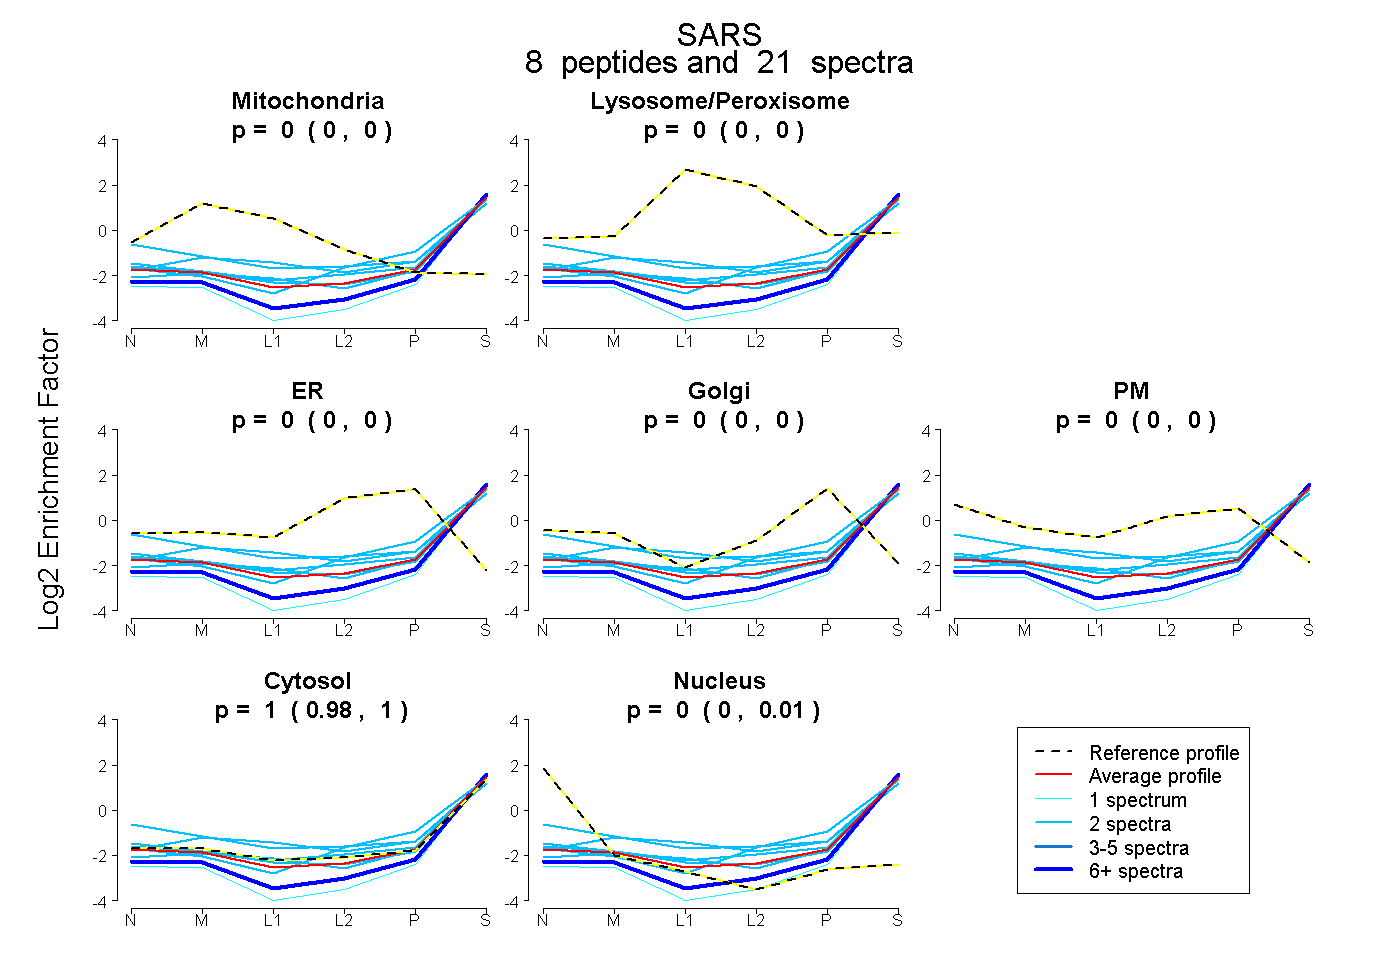
0.000 | 0.000
0.000 | 0.000
0.000 | 0.000
0.000 | 0.000
0.000 | 0.000
0.984 | 1.000
0.000 | 0.014