 4
4peptides
spectra
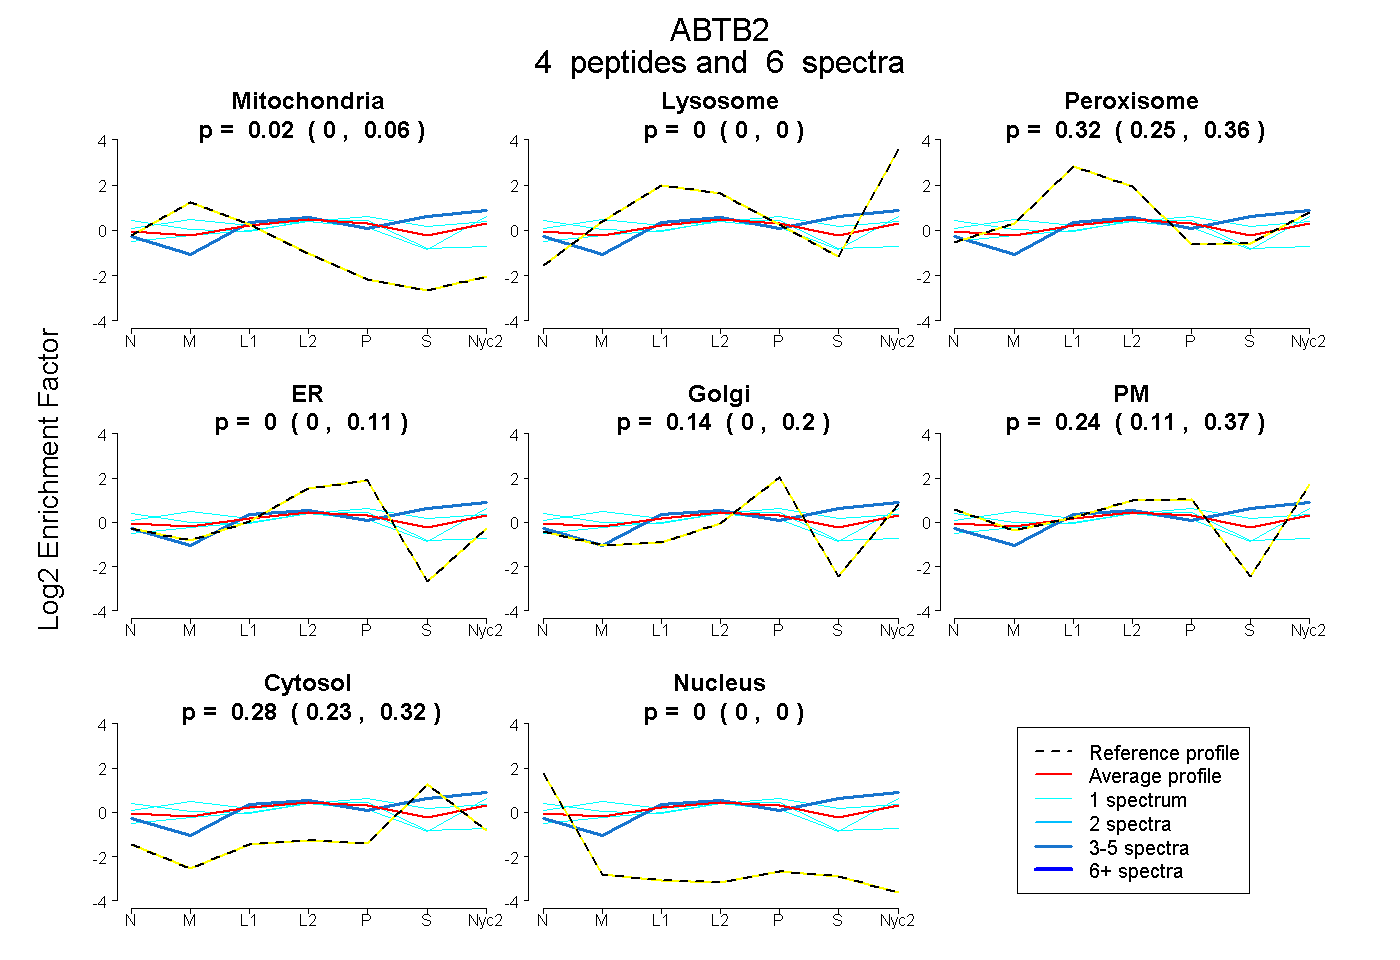
0.000 | 0.062
0.000 | 0.000
0.248 | 0.357
0.000 | 0.105
0.000 | 0.197
0.110 | 0.370
0.230 | 0.322
0.000 | 0.000
1peptide
spectrum
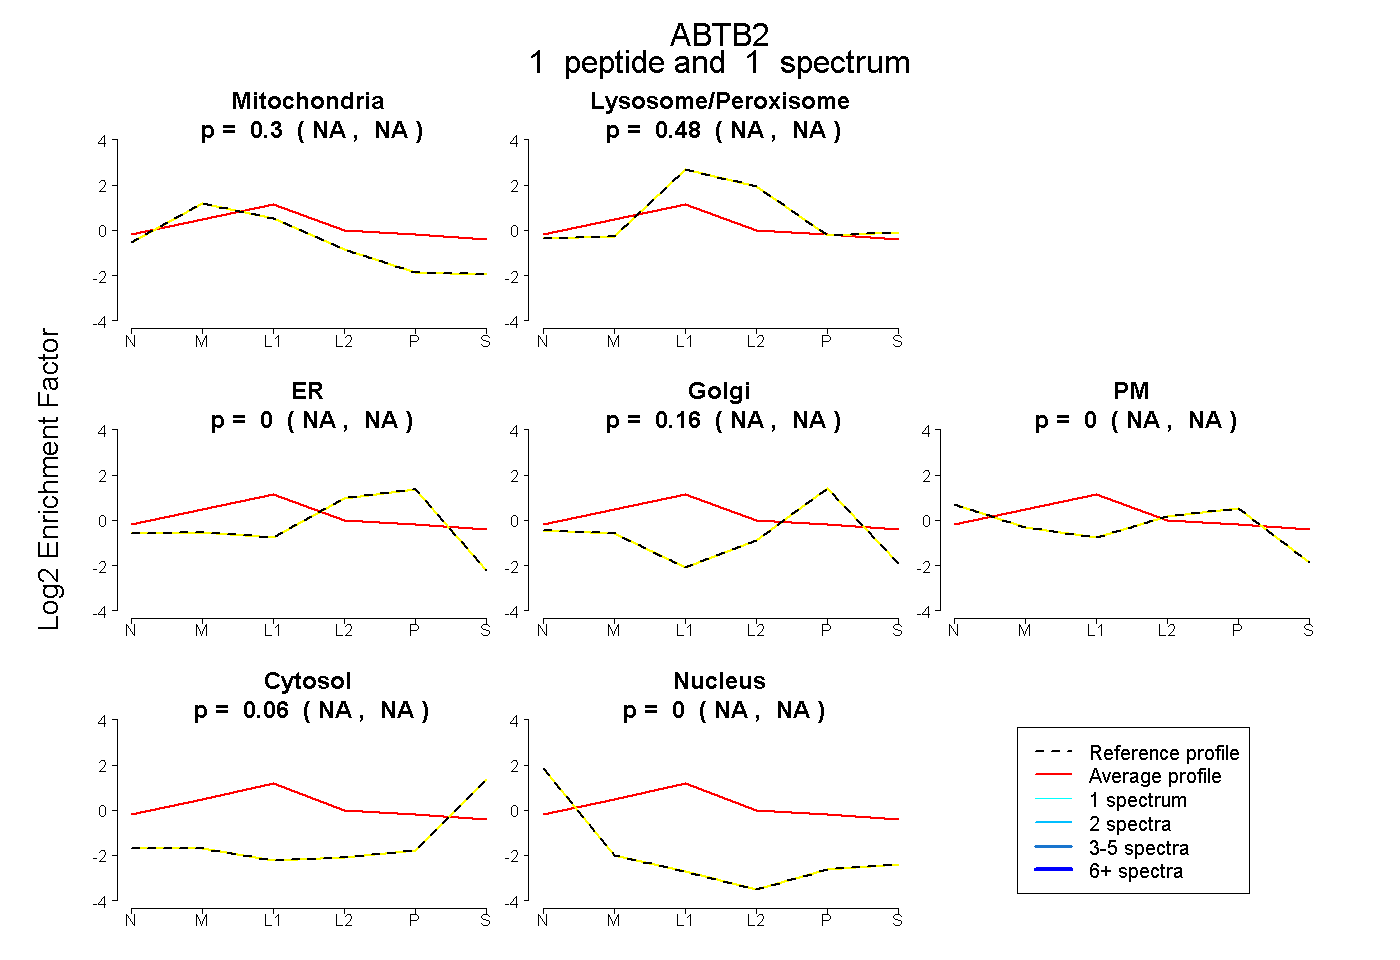
NA | NA
NA | NA
NA | NA
NA | NA
NA | NA
NA | NA
NA | NA
5peptides
spectra
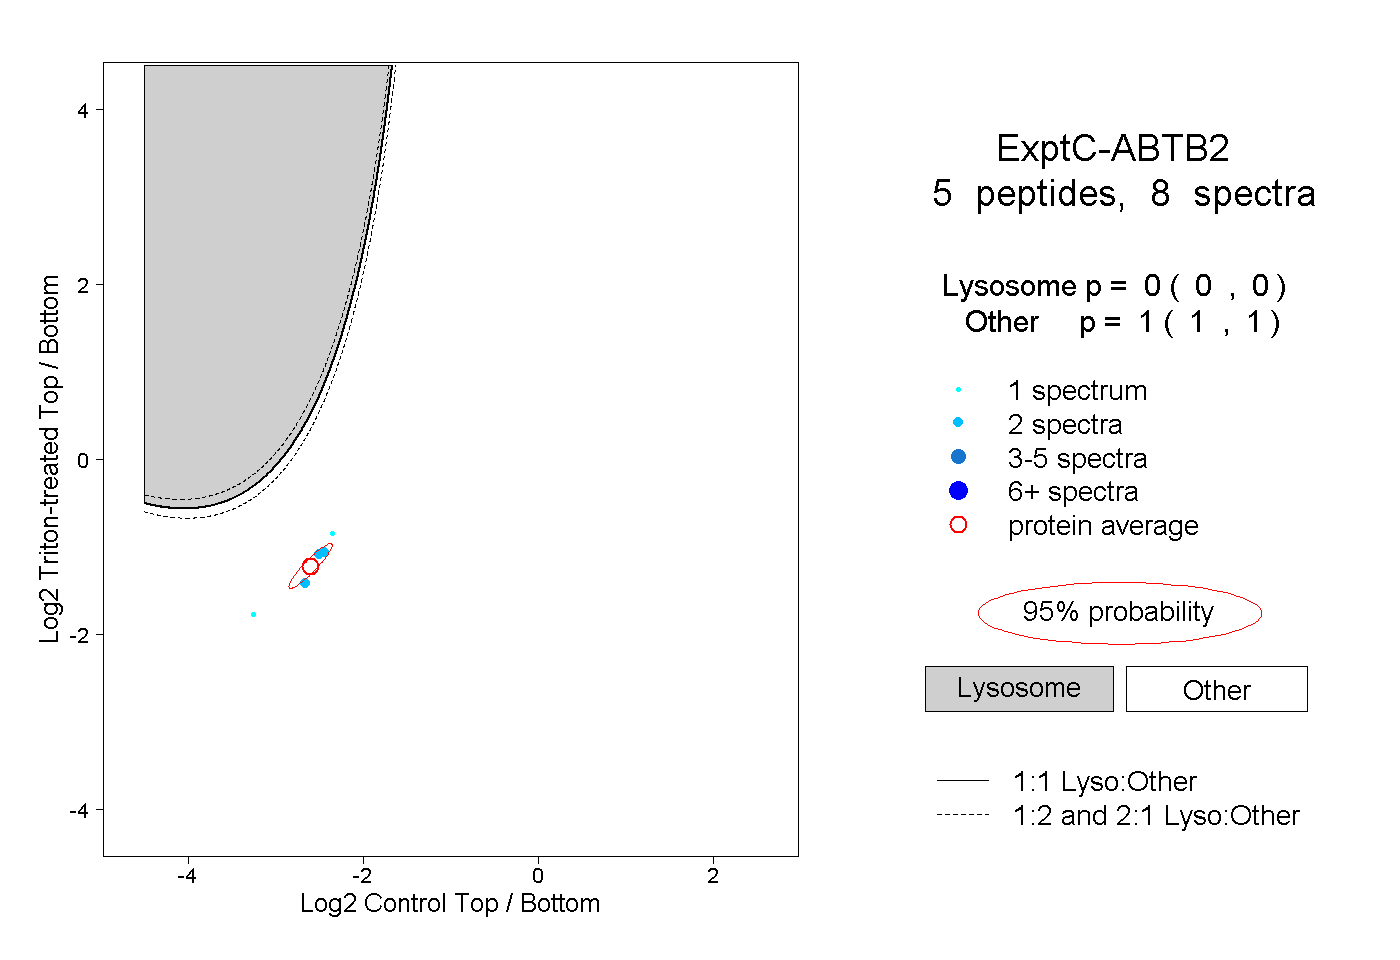
0.000 | 0.000
1.000 | 1.000