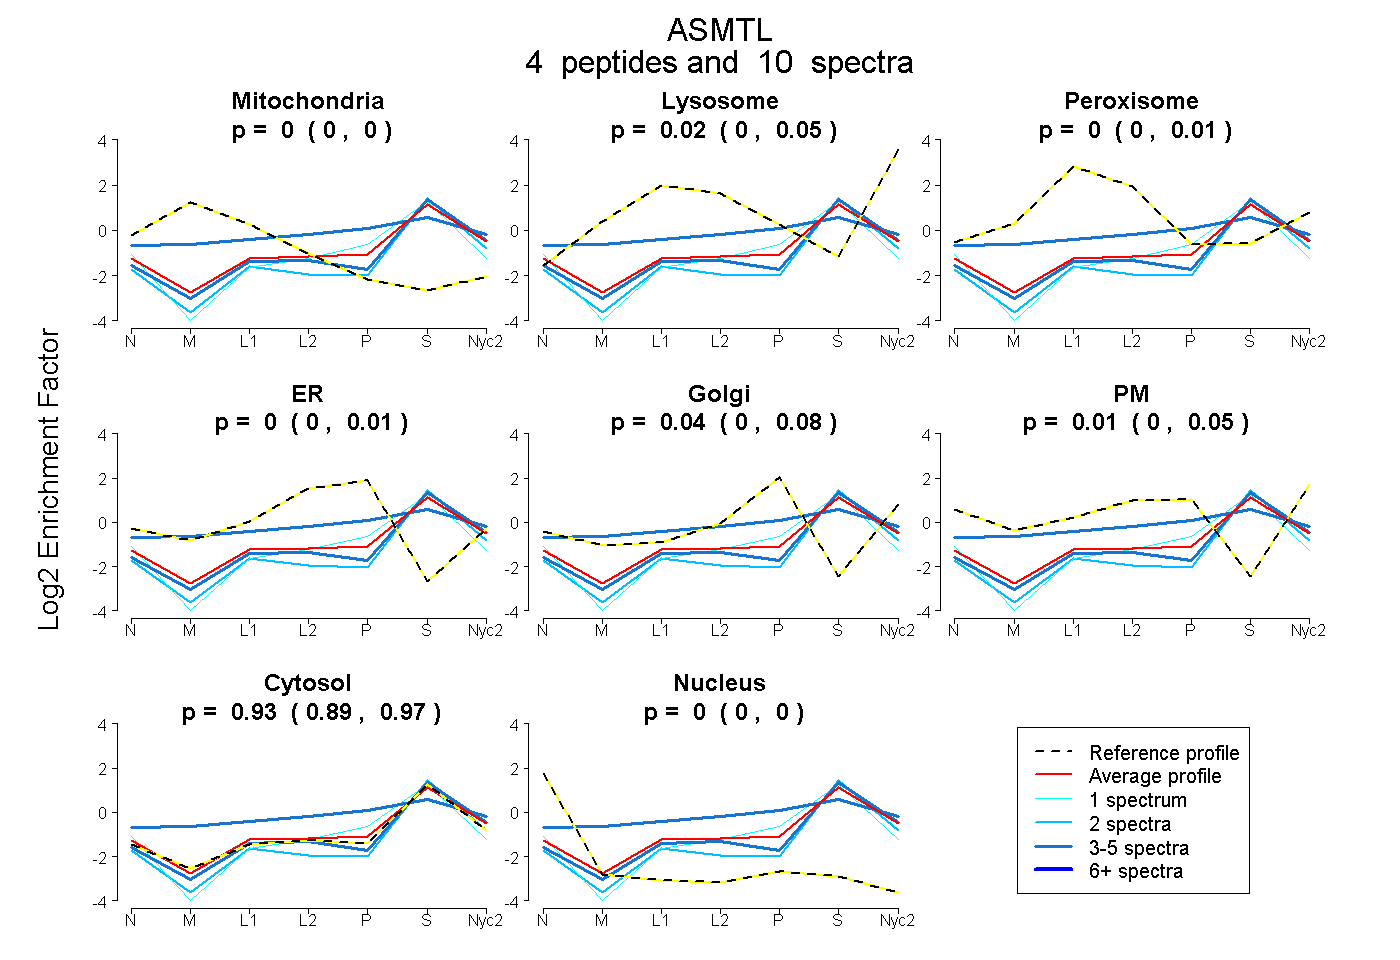
 4
4peptides
spectra
0.000 | 0.000
0.000 | 0.049
0.000 | 0.010
0.000 | 0.005
0.000 | 0.084
0.000 | 0.054
0.890 | 0.967
0.000 | 0.000
| Plot | Mito | Lyso | Perox | ER | Golgi | PM | Cytosol | Nucleus | |||||
| Expt A |
4 peptides |
10 spectra |
|
0.000 0.000 | 0.000 |
0.019 0.000 | 0.049 |
0.000 0.000 | 0.010 |
0.000 0.000 | 0.005 |
0.037 0.000 | 0.084 |
0.009 0.000 | 0.054 |
0.934 0.890 | 0.967 |
0.000 0.000 | 0.000 |
| 3 spectra, GGAIMAEAVR | 0.000 | 0.000 | 0.000 | 0.000 | 0.000 | 0.000 | 1.000 | 0.000 | ||
| 2 spectra, AGGYGLQAR | 0.000 | 0.000 | 0.000 | 0.000 | 0.000 | 0.000 | 0.980 | 0.020 | ||
| 1 spectrum, ALDVGMR | 0.000 | 0.000 | 0.000 | 0.000 | 0.000 | 0.000 | 0.955 | 0.045 | ||
| 4 spectra, GYHVVLASASPR | 0.004 | 0.000 | 0.270 | 0.000 | 0.233 | 0.000 | 0.494 | 0.000 |
| Plot | Mito | Lyso or Perox | ER | Golgi | PM | Cytosol | Nucleus | ||||||
| Expt B |
1 peptide |
3 spectra |
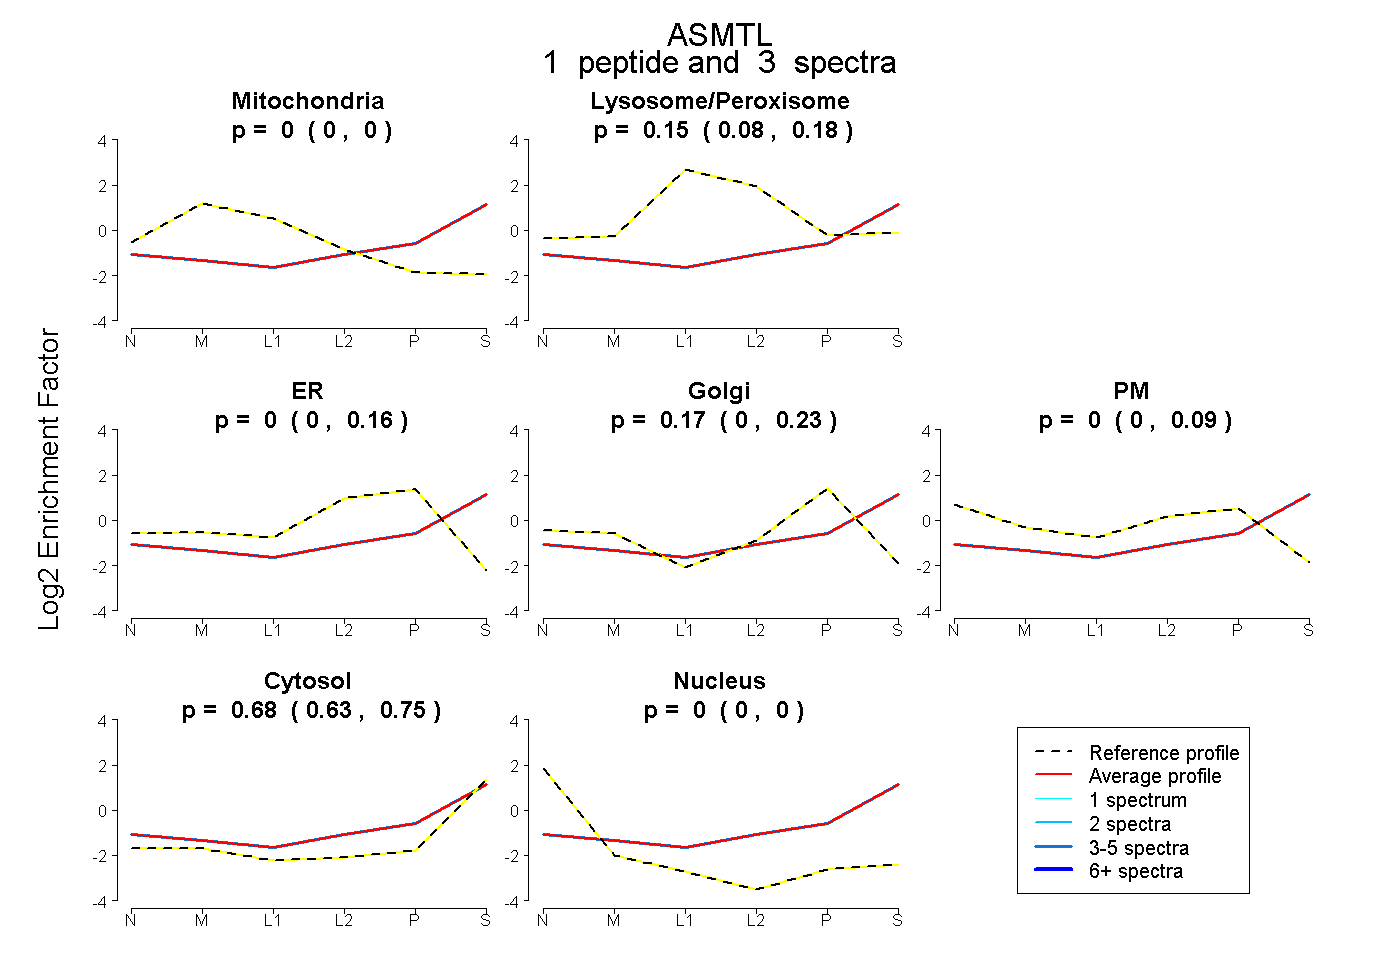 |
0.000 0.000 | 0.000 |
0.149 0.077 | 0.180 |
0.000 0.000 | 0.155 |
0.168 0.000 | 0.225 |
0.000 0.000 | 0.090 |
0.682 0.626 | 0.747 |
0.000 0.000 | 0.000 |
|||
| Plot | Lyso | Other | |||||||||||
| Expt C |
2 peptides |
6 spectra |
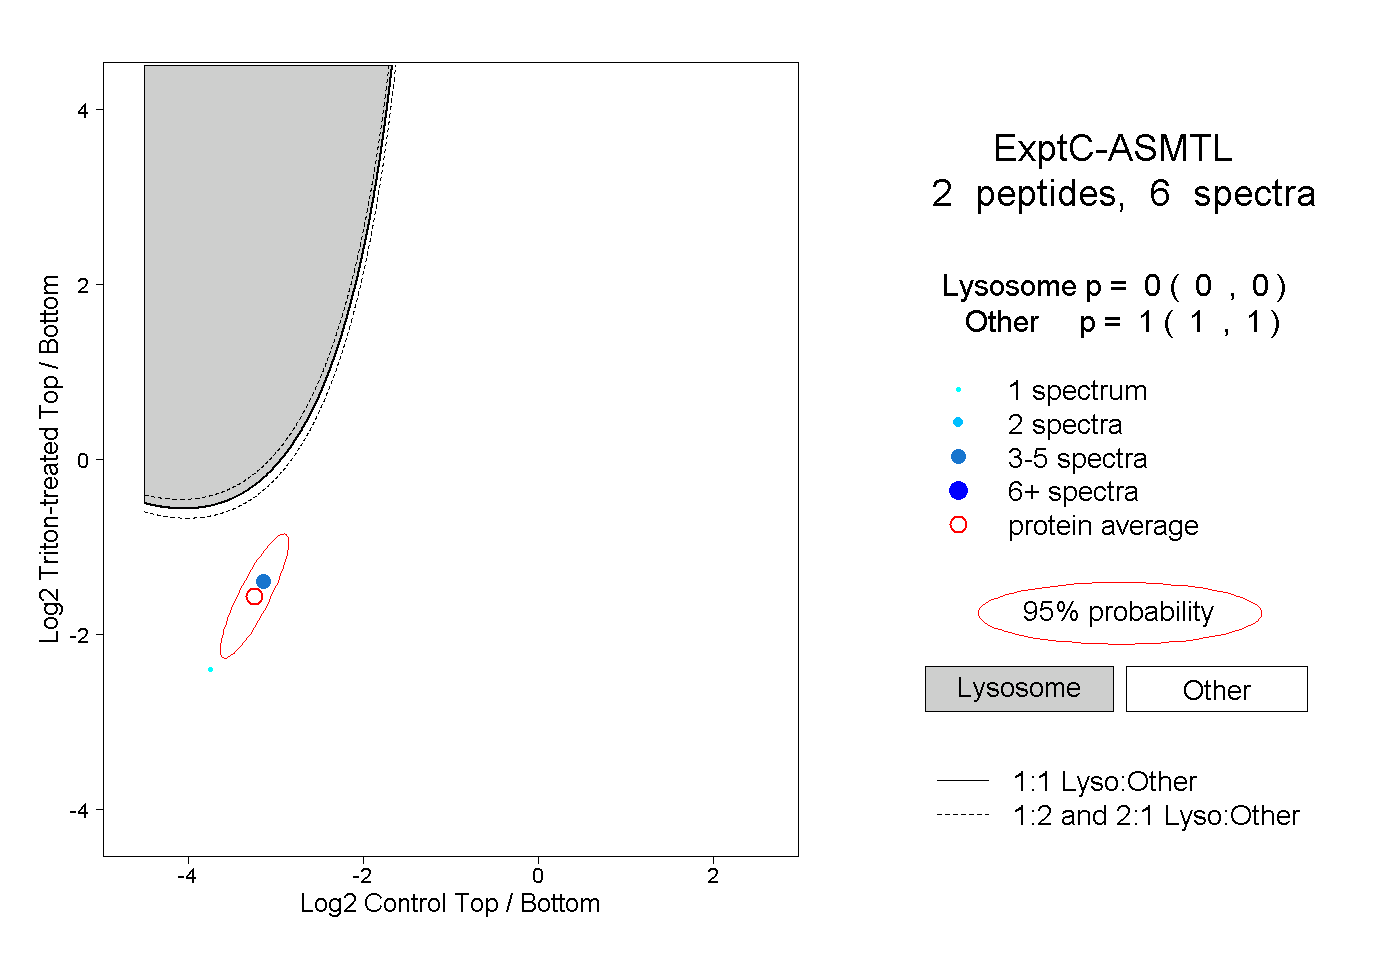 |
0.000 0.000 | 0.000 |
1.000 1.000 | 1.000 |