 4
4peptides
spectra
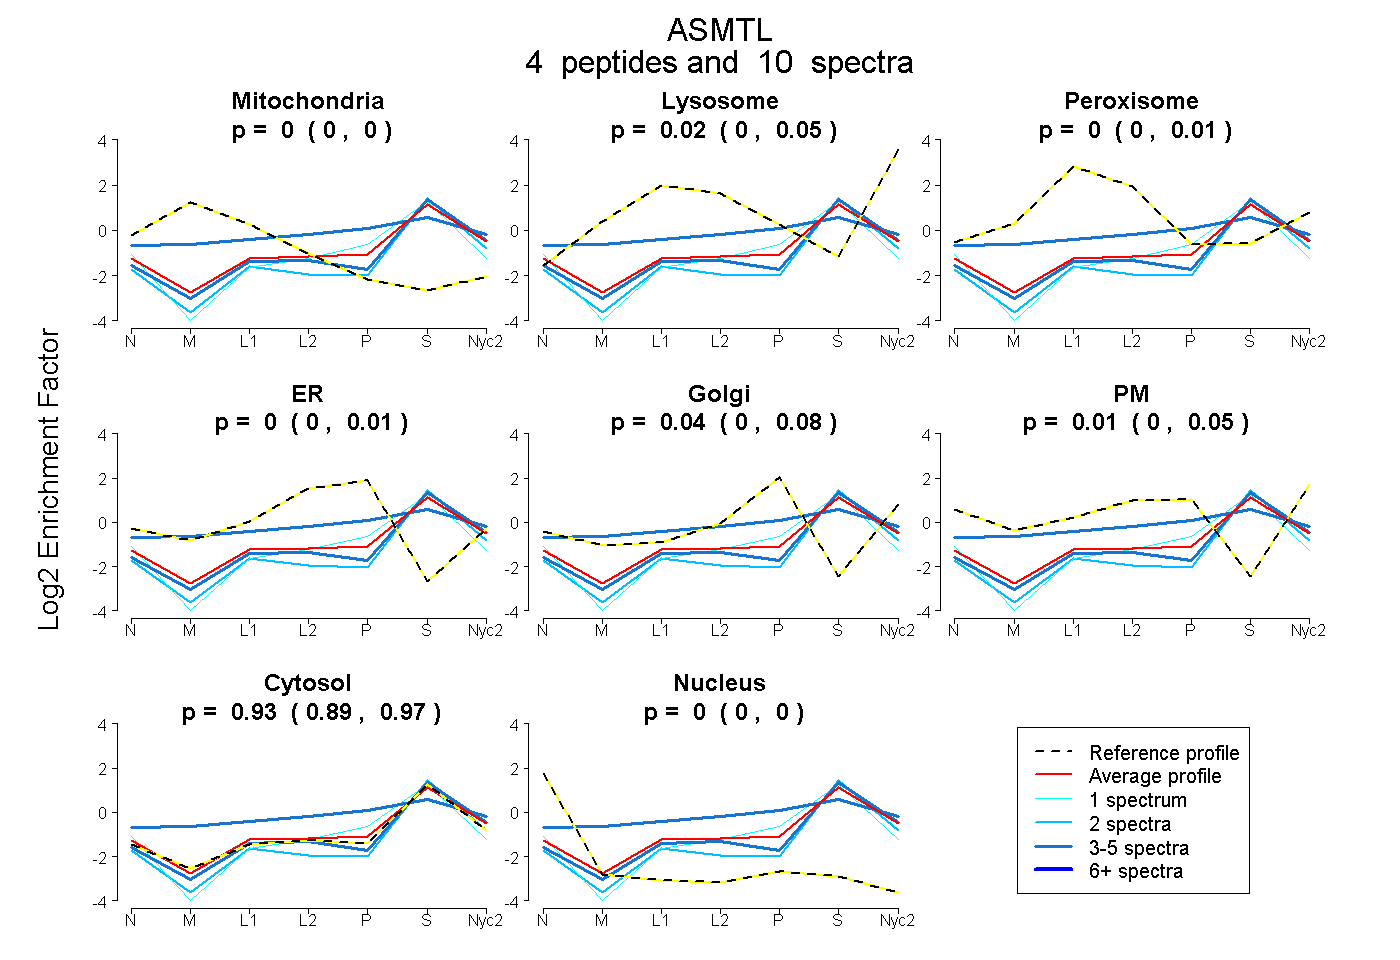
0.000 | 0.000
0.000 | 0.049
0.000 | 0.010
0.000 | 0.005
0.000 | 0.084
0.000 | 0.054
0.890 | 0.967
0.000 | 0.000
1peptide
spectra
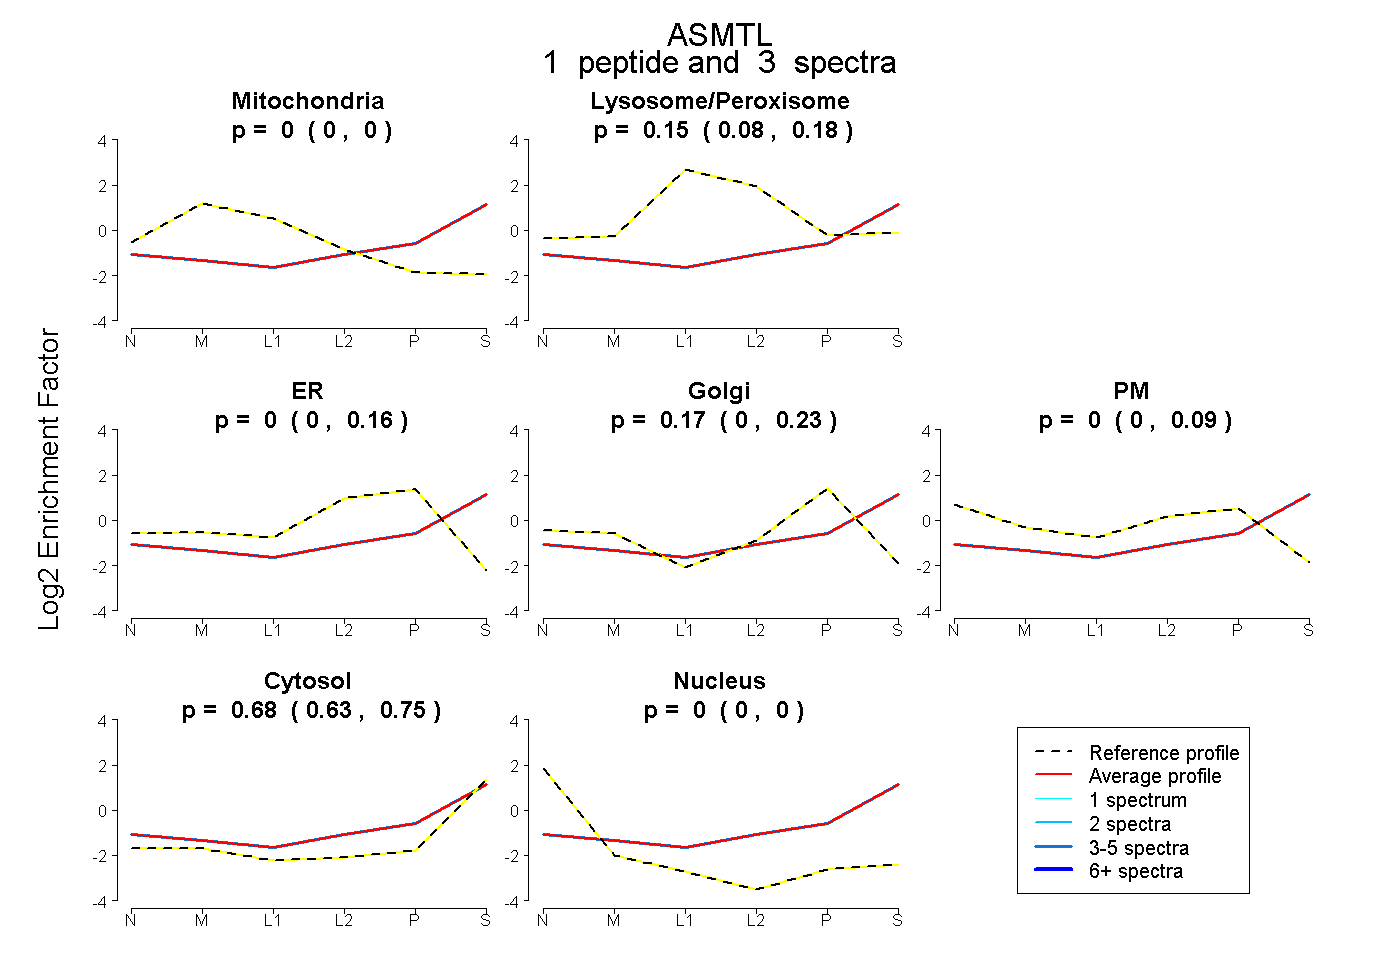
0.000 | 0.000
0.077 | 0.180
0.000 | 0.155
0.000 | 0.225
0.000 | 0.090
0.626 | 0.747
0.000 | 0.000
2peptides
spectra
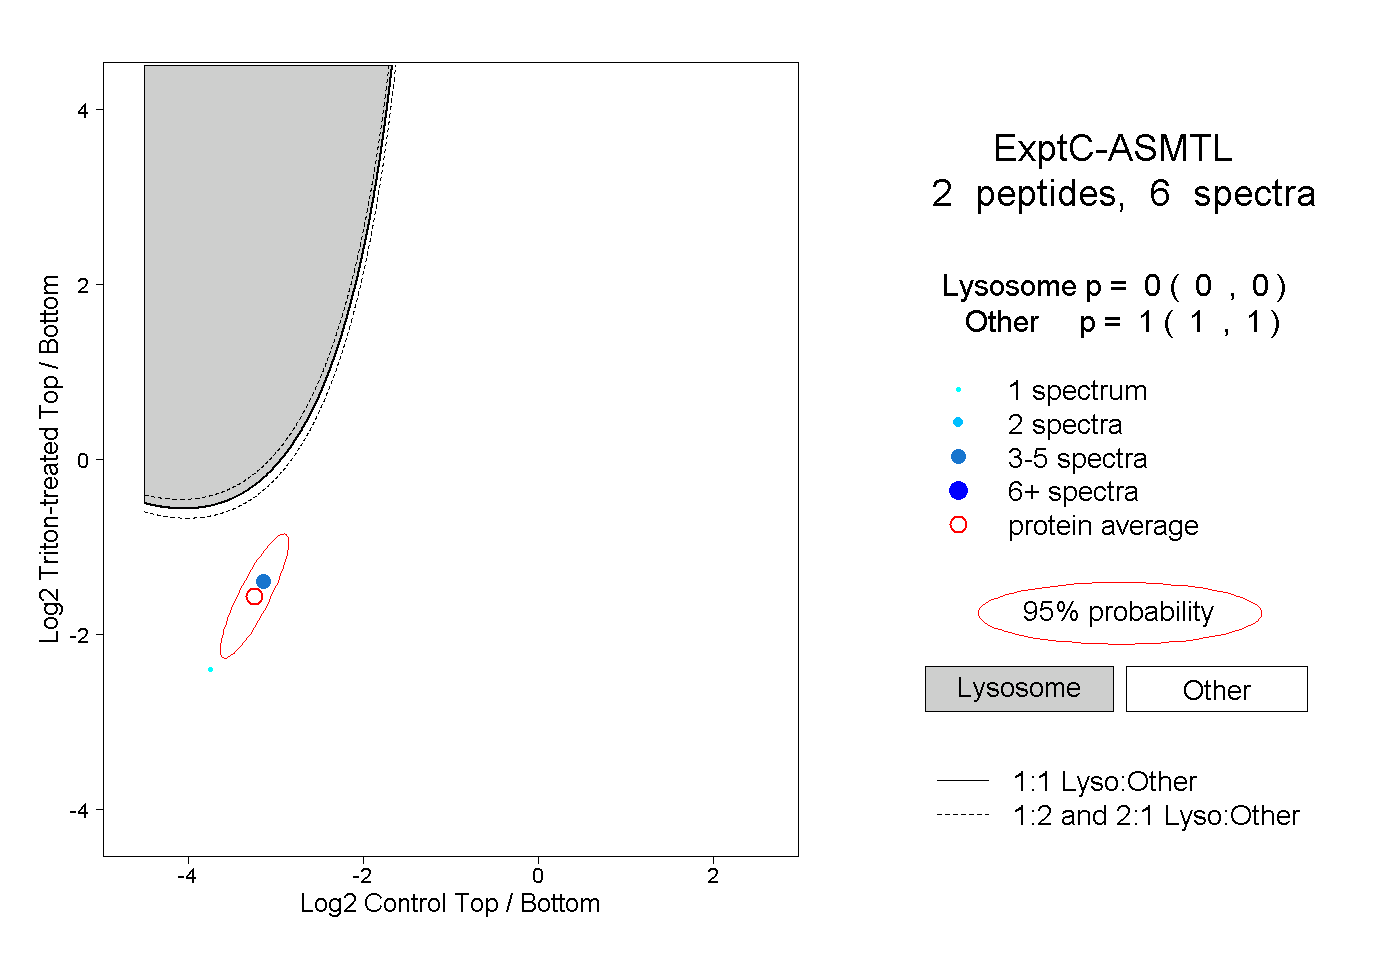
0.000 | 0.000
1.000 | 1.000