 17
17peptides
spectra
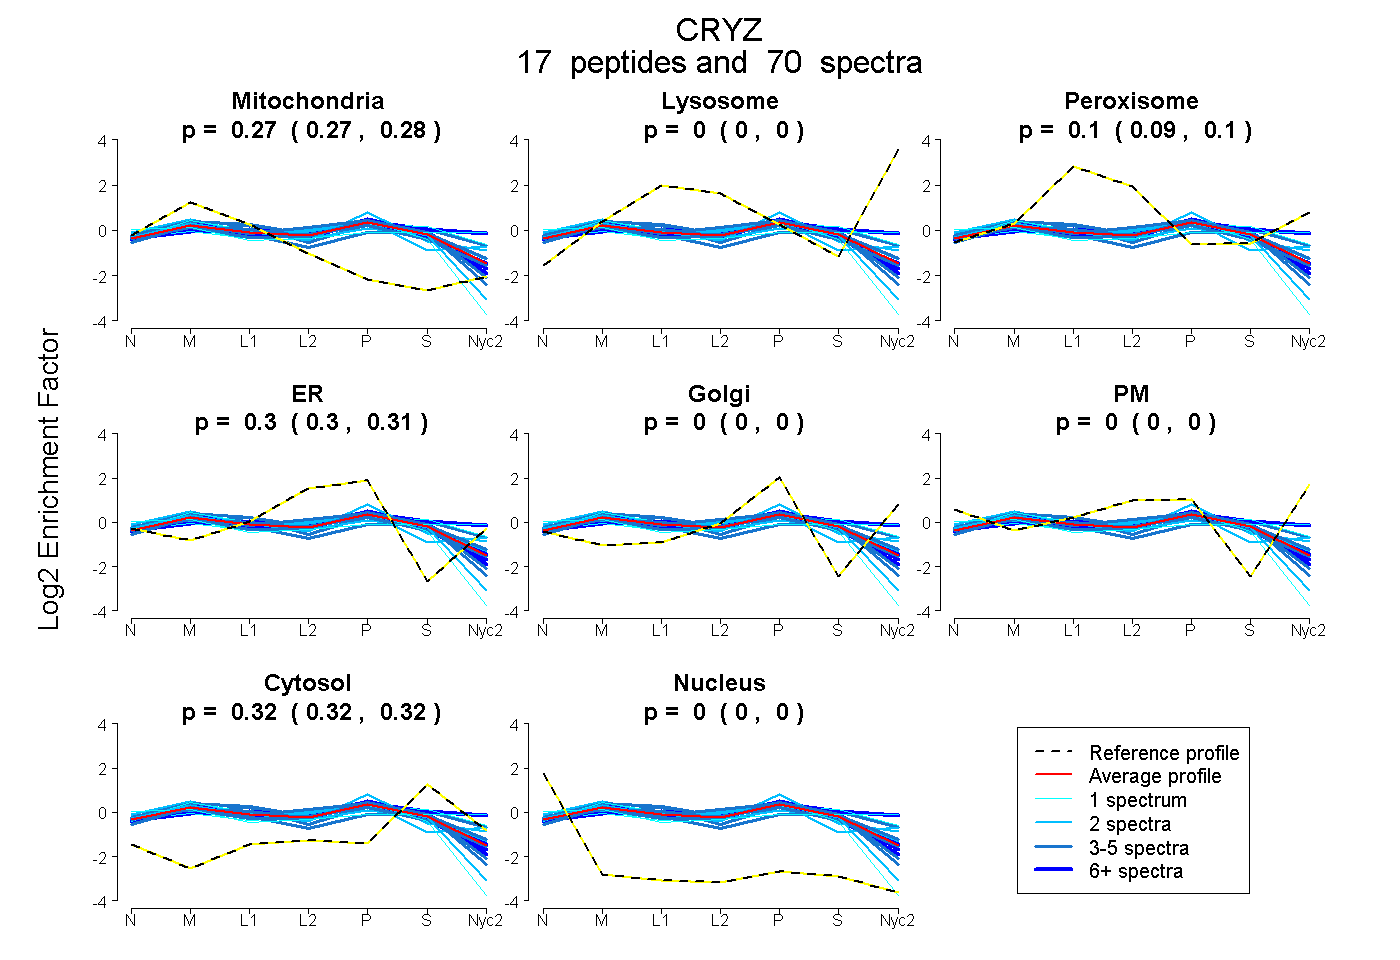
0.269 | 0.279
0.000 | 0.000
0.095 | 0.104
0.301 | 0.307
0.000 | 0.000
0.000 | 0.000
0.319 | 0.324
0.000 | 0.000
11peptides
spectra
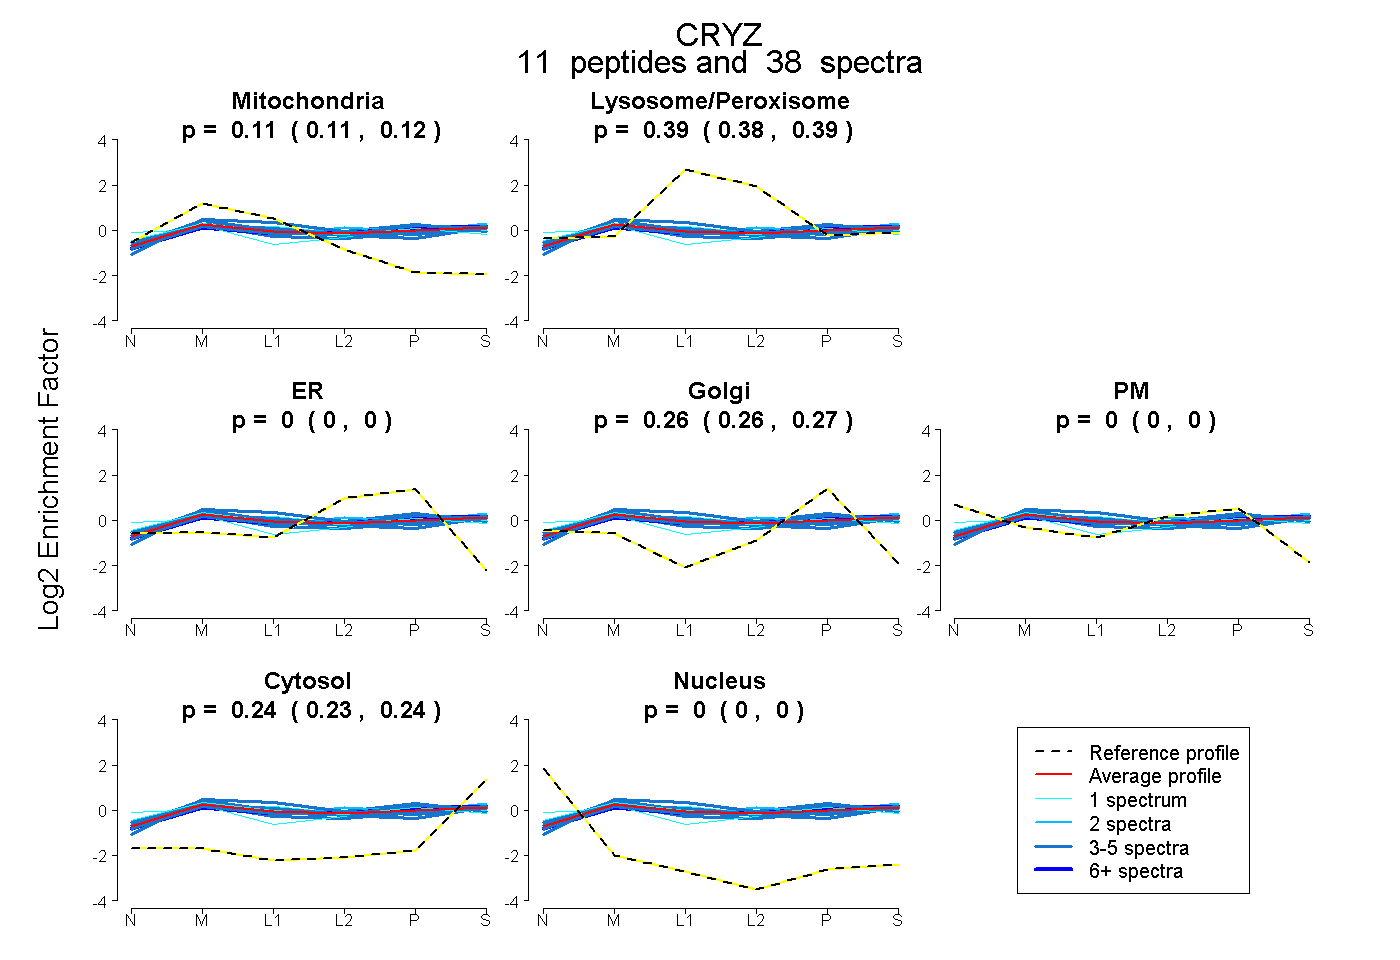
0.108 | 0.117
0.382 | 0.389
0.000 | 0.000
0.259 | 0.269
0.000 | 0.000
0.234 | 0.240
0.000 | 0.000
18peptides
spectra
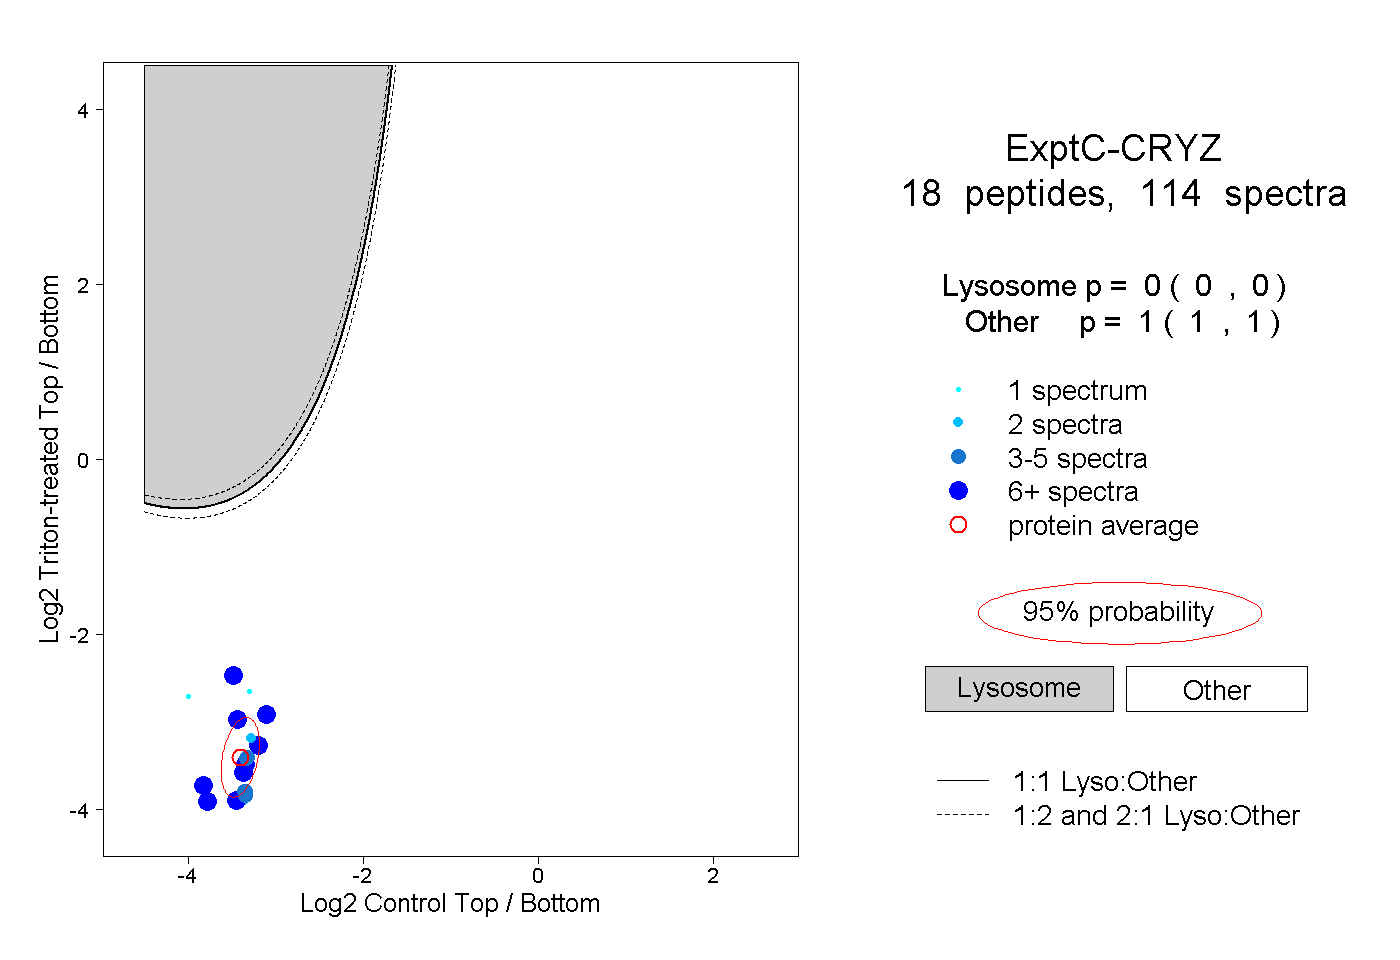
0.000 | 0.000
1.000 | 1.000
9peptides
spectra
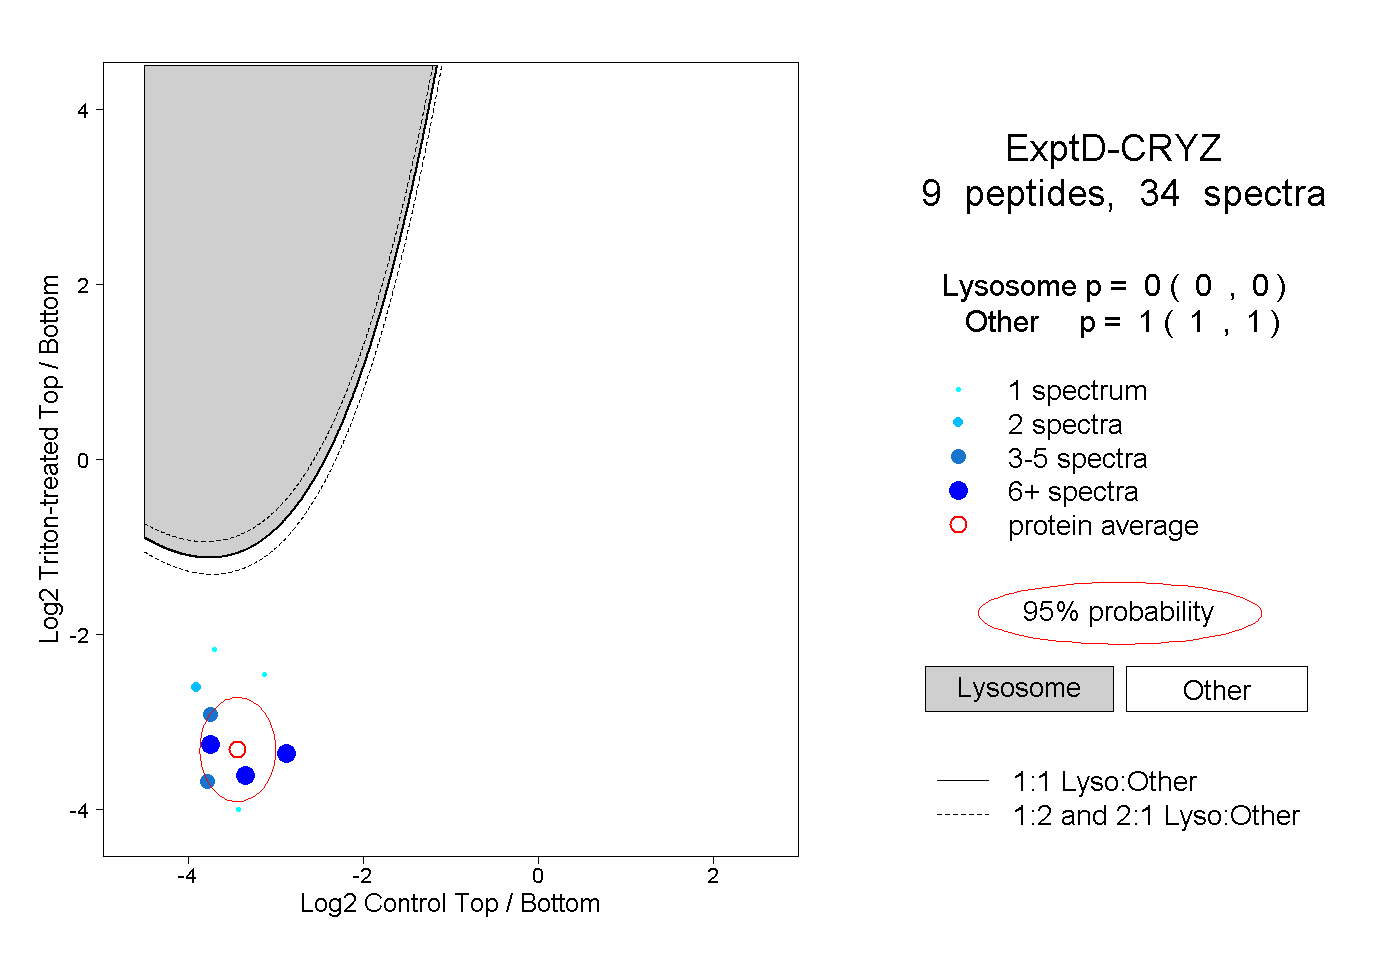
0.000 | 0.000
1.000 | 1.000