 6
6peptides
spectra
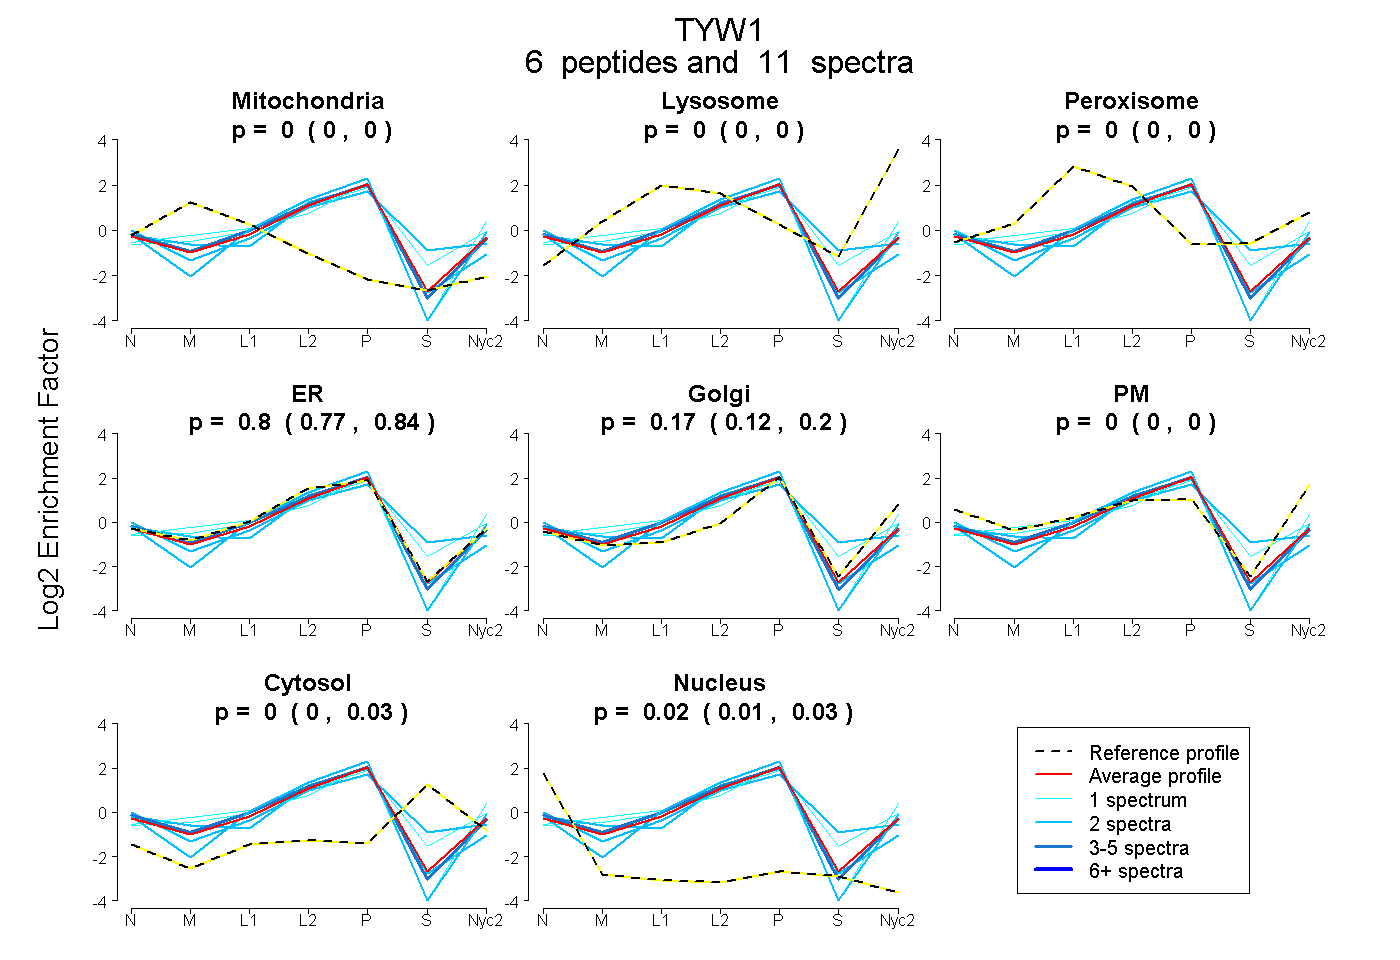
0.000 | 0.000
0.000 | 0.000
0.000 | 0.000
0.766 | 0.839
0.124 | 0.205
0.000 | 0.000
0.000 | 0.025
0.005 | 0.034
1peptide
spectrum
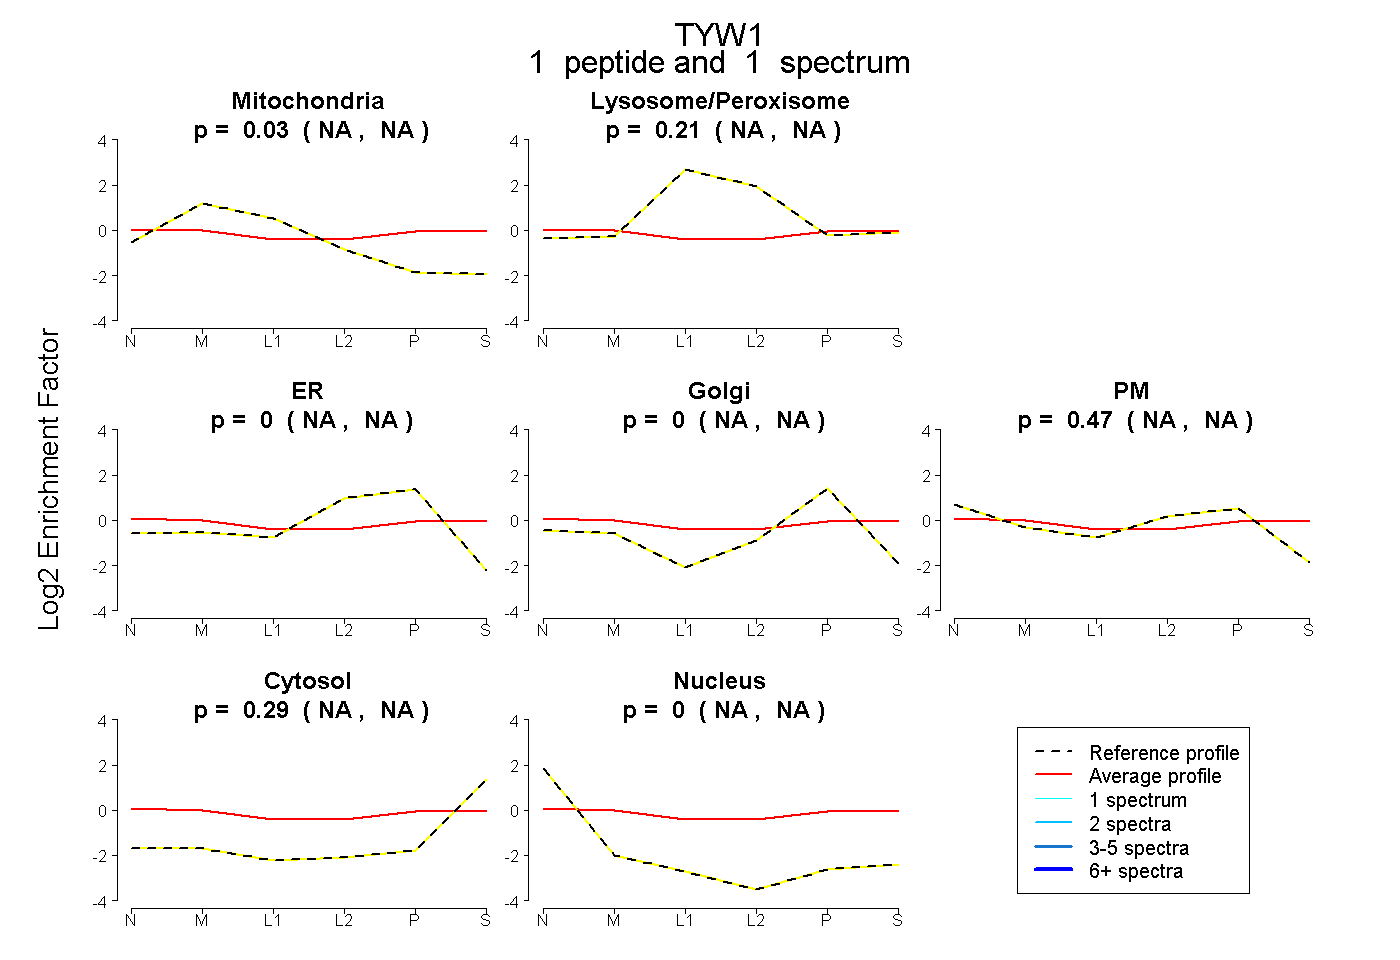
NA | NA
NA | NA
NA | NA
NA | NA
NA | NA
NA | NA
NA | NA
14peptides
spectra
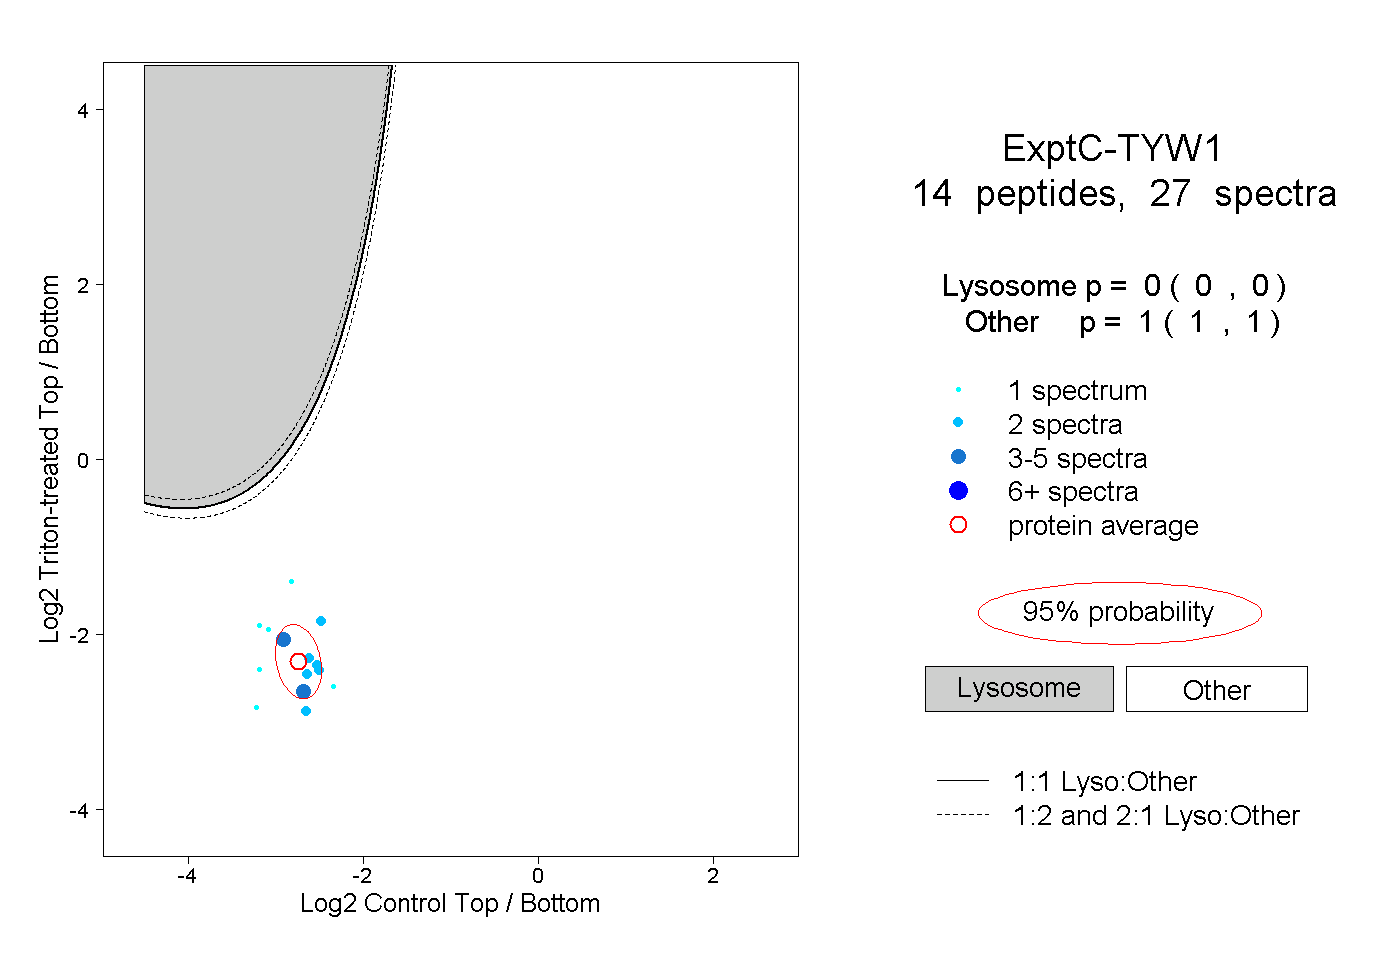
0.000 | 0.000
1.000 | 1.000